
|
Guardion Health Sciences, Inc. (GHSI) DCF -Bewertung |
Fully Editable: Tailor To Your Needs In Excel Or Sheets
Professional Design: Trusted, Industry-Standard Templates
Investor-Approved Valuation Models
MAC/PC Compatible, Fully Unlocked
No Expertise Is Needed; Easy To Follow
Guardion Health Sciences, Inc. (GHSI) Bundle
Entdecken Sie das finanzielle Potenzial von Guardion Health Sciences, Inc. (GHSI) mit unserem benutzerfreundlichen DCF-Taschenrechner! Geben Sie Ihre Projektionen für Wachstum, Margen und Kosten ein, um den inneren Wert von Guardion Health Sciences, Inc. (GHSI) zu berechnen und Ihre Anlagestrategie zu verbessern.
What You Will Get
- Editable Excel Template: A fully customizable Excel-based DCF Calculator featuring pre-filled real GHSI financials.
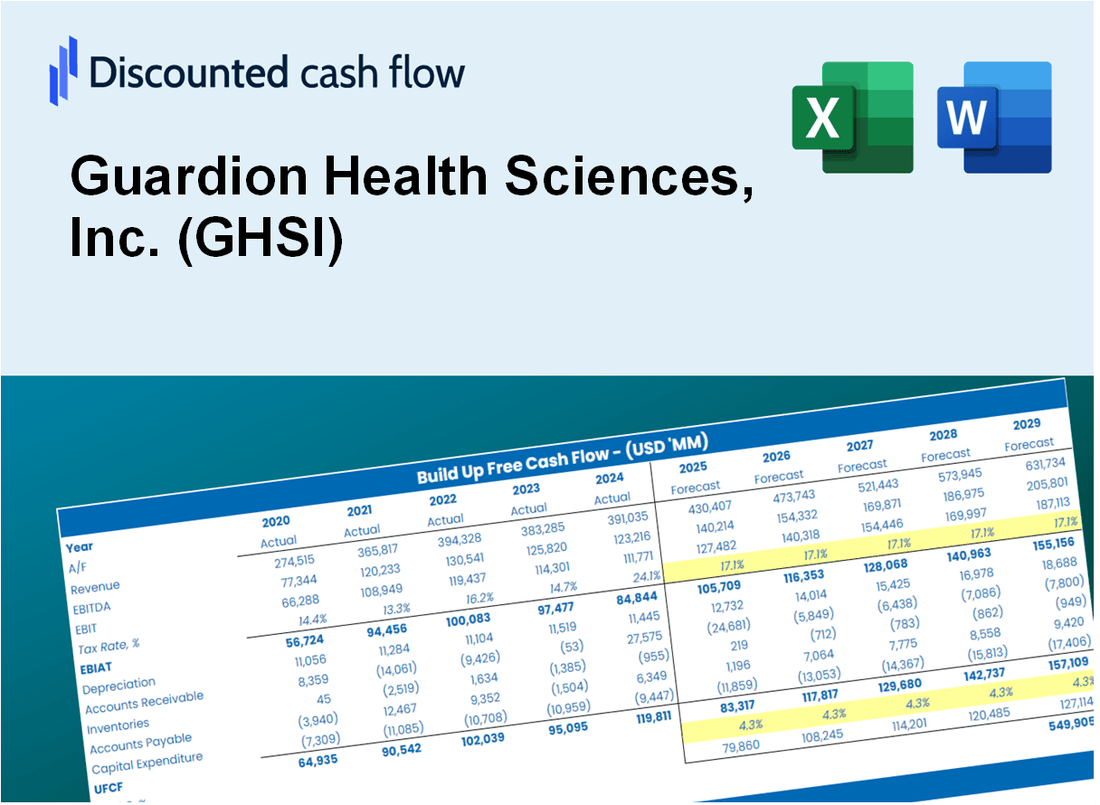
- Real-World Data: Historical data and forward-looking estimates (highlighted in the yellow cells).
- Forecast Flexibility: Modify forecast assumptions such as revenue growth, EBITDA %, and WACC.
- Automatic Calculations: Instantly observe the effect of your inputs on Guardion Health Sciences' valuation.
- Professional Tool: Designed for investors, CFOs, consultants, and financial analysts.
- User-Friendly Design: Organized for clarity and ease of use, complete with step-by-step instructions.
Key Features
- Comprehensive Data Access: GHSI’s historical financial reports and pre-filled projections.
- Customizable Parameters: Modify WACC, tax rates, revenue growth, and EBITDA margins as needed.
- Real-Time Calculations: Observe GHSI’s intrinsic value update instantly.
- Intuitive Visualizations: Dashboard graphs illustrate valuation results and essential metrics.
- Designed for Precision: A reliable tool for analysts, investors, and financial professionals.
How It Works
- Step 1: Download the prebuilt Excel template featuring Guardion Health Sciences, Inc. (GHSI) data.
- Step 2: Navigate through the pre-filled sheets to familiarize yourself with the essential metrics.
- Step 3: Modify forecasts and assumptions in the editable yellow cells (WACC, growth, margins).
- Step 4: Instantly see the updated results, including the intrinsic value of Guardion Health Sciences, Inc. (GHSI).
- Step 5: Utilize the outputs to make informed investment choices or create detailed reports.
Why Choose Guardion Health Sciences, Inc. (GHSI)?
- Innovative Solutions: Cutting-edge health products designed to enhance patient outcomes.
- Proven Expertise: Backed by a team of professionals with extensive industry experience.
- Commitment to Quality: Rigorous testing ensures the highest standards in health science.
- Patient-Centric Approach: Focused on meeting the unique needs of patients and healthcare providers.
- Industry Recognition: Trusted by healthcare professionals and organizations worldwide.
Who Should Use This Product?
- Investors: Evaluate Guardion Health Sciences, Inc. (GHSI) for informed investment decisions.
- CFOs and Financial Analysts: Optimize valuation methods and assess financial forecasts for GHSI.
- Startup Founders: Understand the valuation strategies of public health companies like Guardion Health Sciences, Inc. (GHSI).
- Consultants: Provide clients with detailed valuation analyses for GHSI.
- Students and Educators: Utilize current data to learn and teach valuation practices relevant to GHSI.
What the Template Contains
- Historical Data: Includes Guardion Health Sciences, Inc.'s (GHSI) past financials and baseline forecasts.
- DCF and Levered DCF Models: Detailed templates to calculate Guardion Health Sciences, Inc.'s (GHSI) intrinsic value.
- WACC Sheet: Pre-built calculations for Weighted Average Cost of Capital.
- Editable Inputs: Modify key drivers like growth rates, EBITDA %, and CAPEX assumptions.
- Quarterly and Annual Statements: A complete breakdown of Guardion Health Sciences, Inc.'s (GHSI) financials.
- Interactive Dashboard: Visualize valuation results and projections dynamically.
Disclaimer
All information, articles, and product details provided on this website are for general informational and educational purposes only. We do not claim any ownership over, nor do we intend to infringe upon, any trademarks, copyrights, logos, brand names, or other intellectual property mentioned or depicted on this site. Such intellectual property remains the property of its respective owners, and any references here are made solely for identification or informational purposes, without implying any affiliation, endorsement, or partnership.
We make no representations or warranties, express or implied, regarding the accuracy, completeness, or suitability of any content or products presented. Nothing on this website should be construed as legal, tax, investment, financial, medical, or other professional advice. In addition, no part of this site—including articles or product references—constitutes a solicitation, recommendation, endorsement, advertisement, or offer to buy or sell any securities, franchises, or other financial instruments, particularly in jurisdictions where such activity would be unlawful.
All content is of a general nature and may not address the specific circumstances of any individual or entity. It is not a substitute for professional advice or services. Any actions you take based on the information provided here are strictly at your own risk. You accept full responsibility for any decisions or outcomes arising from your use of this website and agree to release us from any liability in connection with your use of, or reliance upon, the content or products found herein.