
|
Gilead Sciences, Inc. (GILD) DCF -Bewertung |
Fully Editable: Tailor To Your Needs In Excel Or Sheets
Professional Design: Trusted, Industry-Standard Templates
Investor-Approved Valuation Models
MAC/PC Compatible, Fully Unlocked
No Expertise Is Needed; Easy To Follow
Gilead Sciences, Inc. (GILD) Bundle
Unser [GILD] DCF -Taschenrechner entwickelt für die Genauigkeit und ermöglicht es Ihnen, Gilead Sciences, Inc. anhand der tatsächlichen Finanzdaten zu bewerten und vollständige Flexibilität für die Änderung aller Schlüsselparameter für verbesserte Prognosen bereitzustellen.
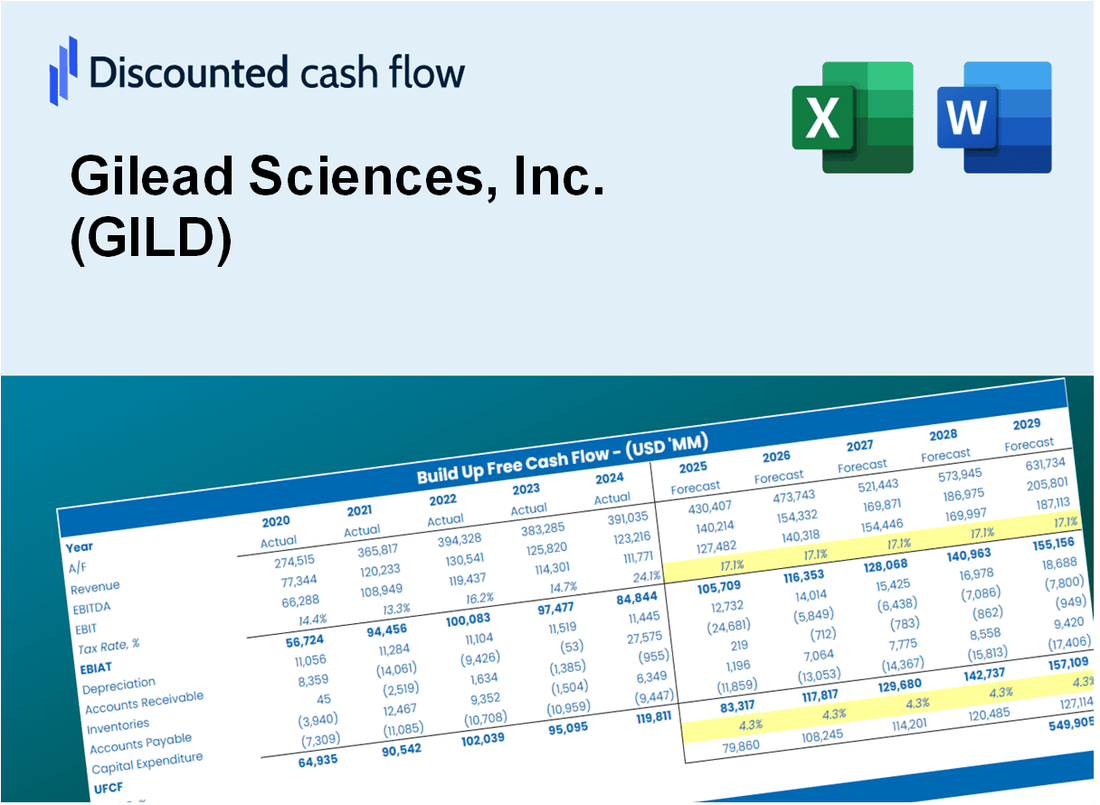
Discounted Cash Flow (DCF) - (USD MM)
| Year | AY1 2020 |
AY2 2021 |
AY3 2022 |
AY4 2023 |
AY5 2024 |
FY1 2025 |
FY2 2026 |
FY3 2027 |
FY4 2028 |
FY5 2029 |
|---|---|---|---|---|---|---|---|---|---|---|
| Revenue | 24,689.0 | 27,305.0 | 27,281.0 | 27,116.0 | 28,754.0 | 27,279.2 | 25,880.0 | 24,552.6 | 23,293.3 | 22,098.5 |
| Revenue Growth, % | 0 | 10.6 | -0.08789599 | -0.60482 | 6.04 | -5.13 | -5.13 | -5.13 | -5.13 | -5.13 |
| EBITDA | 4,133.0 | 11,329.0 | 8,852.0 | 10,496.0 | 4,434.0 | 7,900.4 | 7,495.2 | 7,110.8 | 6,746.0 | 6,400.0 |
| EBITDA, % | 16.74 | 41.49 | 32.45 | 38.71 | 15.42 | 28.96 | 28.96 | 28.96 | 28.96 | 28.96 |
| Depreciation | 1,480.0 | 2,050.0 | 2,103.0 | 2,693.0 | 2,767.0 | 2,224.1 | 2,110.0 | 2,001.8 | 1,899.1 | 1,801.7 |
| Depreciation, % | 5.99 | 7.51 | 7.71 | 9.93 | 9.62 | 8.15 | 8.15 | 8.15 | 8.15 | 8.15 |
| EBIT | 2,653.0 | 9,279.0 | 6,749.0 | 7,803.0 | 1,667.0 | 5,676.3 | 5,385.2 | 5,109.0 | 4,846.9 | 4,598.3 |
| EBIT, % | 10.75 | 33.98 | 24.74 | 28.78 | 5.8 | 20.81 | 20.81 | 20.81 | 20.81 | 20.81 |
| Total Cash | 7,408.0 | 6,520.0 | 6,385.0 | 7,264.0 | 11,568.0 | 7,873.2 | 7,469.4 | 7,086.3 | 6,722.8 | 6,378.0 |
| Total Cash, percent | .0 | .0 | .0 | .0 | .0 | .0 | .0 | .0 | .0 | .0 |
| Account Receivables | 4,892.0 | 4,493.0 | 4,777.0 | 4,660.0 | 4,420.0 | 4,710.4 | 4,468.8 | 4,239.6 | 4,022.1 | 3,815.8 |
| Account Receivables, % | 19.81 | 16.45 | 17.51 | 17.19 | 15.37 | 17.27 | 17.27 | 17.27 | 17.27 | 17.27 |
| Inventories | 1,683.0 | 1,618.0 | 1,507.0 | 1,787.0 | 1,710.0 | 1,680.6 | 1,594.4 | 1,512.6 | 1,435.0 | 1,361.4 |
| Inventories, % | 6.82 | 5.93 | 5.52 | 6.59 | 5.95 | 6.16 | 6.16 | 6.16 | 6.16 | 6.16 |
| Accounts Payable | 844.0 | 705.0 | 905.0 | 550.0 | 833.0 | 777.1 | 737.2 | 699.4 | 663.5 | 629.5 |
| Accounts Payable, % | 3.42 | 2.58 | 3.32 | 2.03 | 2.9 | 2.85 | 2.85 | 2.85 | 2.85 | 2.85 |
| Capital Expenditure | -650.0 | -579.0 | -728.0 | -585.0 | -523.0 | -621.9 | -590.0 | -559.7 | -531.0 | -503.8 |
| Capital Expenditure, % | -2.63 | -2.12 | -2.67 | -2.16 | -1.82 | -2.28 | -2.28 | -2.28 | -2.28 | -2.28 |
| Tax Rate, % | 30.43 | 30.43 | 30.43 | 30.43 | 30.43 | 30.43 | 30.43 | 30.43 | 30.43 | 30.43 |
| EBITAT | 195.5 | 6,977.7 | 5,330.5 | 6,444.7 | 1,159.7 | 3,561.4 | 3,378.7 | 3,205.4 | 3,041.0 | 2,885.1 |
| Depreciation | ||||||||||
| Changes in Account Receivables | ||||||||||
| Changes in Inventories | ||||||||||
| Changes in Accounts Payable | ||||||||||
| Capital Expenditure | ||||||||||
| UFCF | -4,705.5 | 8,773.7 | 6,732.5 | 8,034.7 | 4,003.7 | 4,846.7 | 5,186.7 | 4,920.7 | 4,668.3 | 4,428.9 |
| WACC, % | 4.61 | 4.99 | 5.01 | 5.03 | 4.96 | 4.92 | 4.92 | 4.92 | 4.92 | 4.92 |
| PV UFCF | ||||||||||
| SUM PV UFCF | 20,927.2 | |||||||||
| Long Term Growth Rate, % | 3.00 | |||||||||
| Free cash flow (T + 1) | 4,562 | |||||||||
| Terminal Value | 237,560 | |||||||||
| Present Terminal Value | 186,843 | |||||||||
| Enterprise Value | 207,770 | |||||||||
| Net Debt | 16,720 | |||||||||
| Equity Value | 191,050 | |||||||||
| Diluted Shares Outstanding, MM | 1,255 | |||||||||
| Equity Value Per Share | 152.23 |
What You Will Get
- Real GILD Financial Data: Pre-filled with Gilead Sciences’ historical and projected data for precise analysis.
- Fully Editable Template: Modify key inputs like revenue growth, WACC, and EBITDA % with ease.
- Automatic Calculations: See Gilead Sciences’ intrinsic value update instantly based on your changes.
- Professional Valuation Tool: Designed for investors, analysts, and consultants seeking accurate DCF results.
- User-Friendly Design: Simple structure and clear instructions for all experience levels.
Key Features
- Comprehensive DCF Calculator: Offers detailed unlevered and levered DCF valuation models tailored for Gilead Sciences, Inc. (GILD).
- WACC Calculator: Comes with a pre-built Weighted Average Cost of Capital sheet featuring customizable inputs specific to GILD.
- Adjustable Forecast Assumptions: Easily modify growth rates, capital expenditures, and discount rates to fit Gilead's financial outlook.
- Integrated Financial Ratios: Evaluate profitability, leverage, and efficiency ratios relevant to Gilead Sciences, Inc. (GILD).
- Dashboard and Visualizations: Graphical outputs present key valuation metrics for straightforward analysis of GILD.
How It Works
- Step 1: Download the Excel file.
- Step 2: Review Gilead Sciences, Inc.'s pre-filled financial data and forecasts.
- Step 3: Modify critical inputs like revenue growth, WACC, and tax rates (highlighted cells).
- Step 4: Watch the DCF model update instantly as you adjust your assumptions.
- Step 5: Analyze the outputs and leverage the results for investment decisions.
Why Choose This Calculator for Gilead Sciences, Inc. (GILD)?
- Comprehensive Tool: Features DCF, WACC, and financial ratio analyses all in one solution.
- Customizable Inputs: Modify yellow-highlighted cells to explore different scenarios.
- Detailed Insights: Automatically computes Gilead's intrinsic value and Net Present Value.
- Preloaded Data: Historical and projected data provide reliable starting points.
- Professional Quality: Perfect for financial analysts, investors, and business consultants.
Who Should Use Gilead Sciences, Inc. (GILD) Products?
- Healthcare Investors: Make informed investment choices with comprehensive market analysis tools.
- Pharmaceutical Analysts: Streamline your research with detailed reports and data on drug development.
- Consultants: Easily customize presentations for clients focusing on biopharmaceutical strategies.
- Life Sciences Enthusiasts: Enhance your knowledge of biotechnology and pharmaceutical innovations through case studies.
- Educators and Students: Utilize as a resource for real-world applications in healthcare and pharmaceutical education.
What the Template Contains
- Pre-Filled DCF Model: Gilead Sciences’ financial data preloaded for immediate use.
- WACC Calculator: Detailed calculations for Weighted Average Cost of Capital.
- Financial Ratios: Evaluate Gilead’s profitability, leverage, and efficiency.
- Editable Inputs: Change assumptions such as growth, margins, and CAPEX to fit your scenarios.
- Financial Statements: Annual and quarterly reports to support detailed analysis.
- Interactive Dashboard: Easily visualize key valuation metrics and results.
Disclaimer
All information, articles, and product details provided on this website are for general informational and educational purposes only. We do not claim any ownership over, nor do we intend to infringe upon, any trademarks, copyrights, logos, brand names, or other intellectual property mentioned or depicted on this site. Such intellectual property remains the property of its respective owners, and any references here are made solely for identification or informational purposes, without implying any affiliation, endorsement, or partnership.
We make no representations or warranties, express or implied, regarding the accuracy, completeness, or suitability of any content or products presented. Nothing on this website should be construed as legal, tax, investment, financial, medical, or other professional advice. In addition, no part of this site—including articles or product references—constitutes a solicitation, recommendation, endorsement, advertisement, or offer to buy or sell any securities, franchises, or other financial instruments, particularly in jurisdictions where such activity would be unlawful.
All content is of a general nature and may not address the specific circumstances of any individual or entity. It is not a substitute for professional advice or services. Any actions you take based on the information provided here are strictly at your own risk. You accept full responsibility for any decisions or outcomes arising from your use of this website and agree to release us from any liability in connection with your use of, or reliance upon, the content or products found herein.