
|
Erzeugungseinkommenseigenschaften, Inc. (GIPR) DCF -Bewertung |
Fully Editable: Tailor To Your Needs In Excel Or Sheets
Professional Design: Trusted, Industry-Standard Templates
Investor-Approved Valuation Models
MAC/PC Compatible, Fully Unlocked
No Expertise Is Needed; Easy To Follow
Generation Income Properties, Inc. (GIPR) Bundle
Möchten Sie den inneren Wert von Generation Income Properties, Inc. bewerten? Unser GIPR DCF-Taschenrechner integriert reale Daten mit umfassenden Anpassungsfunktionen, sodass Sie Ihre Prognosen verfeinern und Ihre Investitionsauswahl verbessern können.
What You Will Get
- Editable Forecast Inputs: Effortlessly adjust assumptions (growth %, margins, WACC) to explore various scenarios.
- Real-World Data: Generation Income Properties, Inc. (GIPR) financial data pre-filled to kickstart your analysis.
- Automatic DCF Outputs: The template computes Net Present Value (NPV) and intrinsic value for you.
- Customizable and Professional: A refined Excel model that caters to your valuation requirements.
- Built for Analysts and Investors: Perfect for evaluating projections, validating strategies, and enhancing efficiency.
Key Features
- Real-Time GIPR Data: Pre-loaded with Generation Income Properties' historical performance metrics and future growth estimates.
- Comprehensive Input Customization: Modify rental income, operating expenses, capitalization rates, and investment assumptions.
- Interactive Valuation Framework: Instant recalculations of Net Present Value (NPV) and intrinsic value based on your customized inputs.
- Multiple Scenario Analysis: Develop various forecasting scenarios to evaluate diverse valuation possibilities.
- Intuitive User Interface: Clean, organized, and accessible for both industry experts and newcomers.
How It Works
- Download the Template: Gain immediate access to the Excel-based GIPR DCF Calculator.
- Input Your Assumptions: Modify the yellow-highlighted cells for growth rates, WACC, margins, and additional parameters.
- Instant Calculations: The model automatically refreshes the intrinsic value of Generation Income Properties, Inc. (GIPR).
- Test Scenarios: Experiment with various assumptions to assess potential valuation fluctuations.
- Analyze and Decide: Utilize the outcomes to inform your investment or financial analysis.
Why Choose This Calculator for Generation Income Properties, Inc. (GIPR)?
- Accurate Data: Up-to-date financials from GIPR provide trustworthy valuation outcomes.
- Customizable: Tailor key inputs such as growth rates, WACC, and tax rates to fit your forecasts.
- Time-Saving: Ready-made calculations save you the hassle of starting from the ground up.
- Professional-Grade Tool: Crafted for investors, analysts, and consultants in the real estate sector.
- User-Friendly: Simple layout and guided instructions make it accessible for all users.
Who Should Use Generation Income Properties, Inc. (GIPR)?
- Real Estate Investors: Assess GIPR's performance and potential before making investment decisions.
- Financial Analysts and Advisors: Enhance analysis processes and evaluate income-generating properties.
- Property Managers: Understand how public real estate companies like GIPR manage assets.
- Consultants: Provide clients with detailed reports on real estate valuations and market trends.
- Students and Educators: Utilize GIPR's data to teach and learn about real estate investment strategies.
What the Template Contains
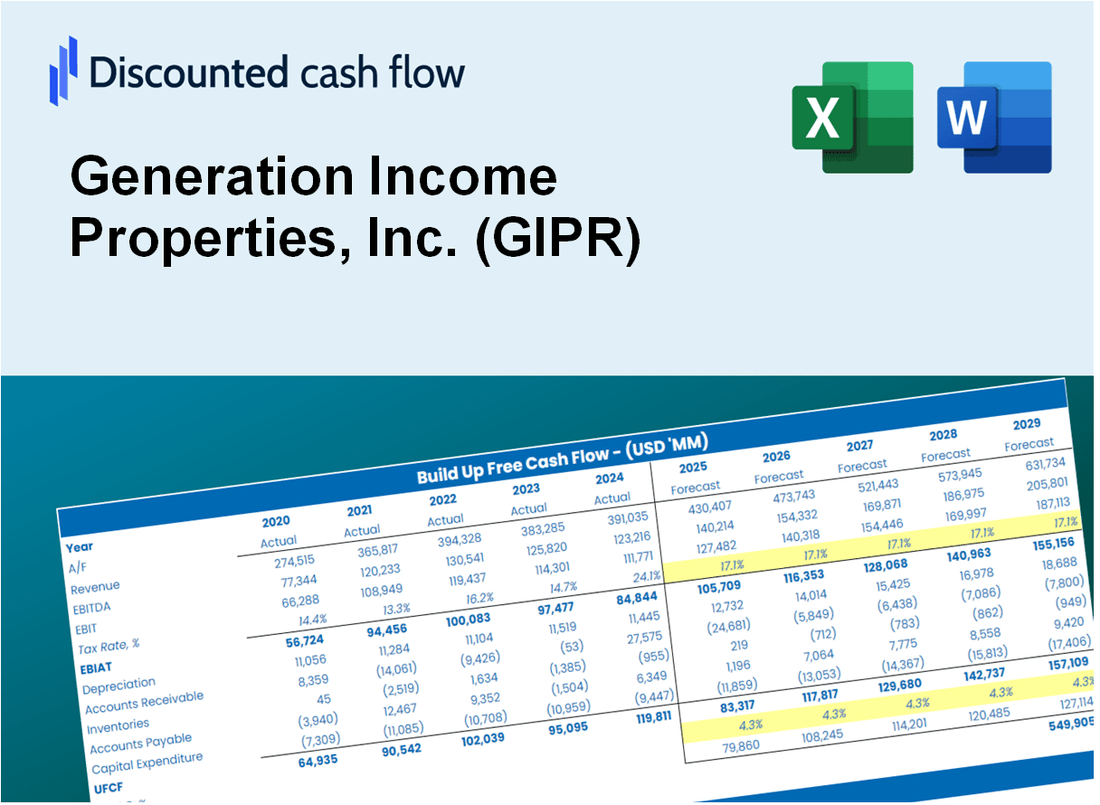
- Operating and Balance Sheet Data: Pre-filled Generation Income Properties, Inc. (GIPR) historical data and forecasts, including revenue, EBITDA, EBIT, and capital expenditures.
- WACC Calculation: A dedicated sheet for Weighted Average Cost of Capital (WACC), featuring parameters like Beta, risk-free rate, and share price.
- DCF Valuation (Unlevered and Levered): Editable Discounted Cash Flow models illustrating intrinsic value with comprehensive calculations.
- Financial Statements: Pre-loaded financial statements (annual and quarterly) to facilitate analysis.
- Key Ratios: Includes profitability, leverage, and efficiency ratios for Generation Income Properties, Inc. (GIPR).
- Dashboard and Charts: Visual summary of valuation outputs and assumptions to simplify result analysis.
Disclaimer
All information, articles, and product details provided on this website are for general informational and educational purposes only. We do not claim any ownership over, nor do we intend to infringe upon, any trademarks, copyrights, logos, brand names, or other intellectual property mentioned or depicted on this site. Such intellectual property remains the property of its respective owners, and any references here are made solely for identification or informational purposes, without implying any affiliation, endorsement, or partnership.
We make no representations or warranties, express or implied, regarding the accuracy, completeness, or suitability of any content or products presented. Nothing on this website should be construed as legal, tax, investment, financial, medical, or other professional advice. In addition, no part of this site—including articles or product references—constitutes a solicitation, recommendation, endorsement, advertisement, or offer to buy or sell any securities, franchises, or other financial instruments, particularly in jurisdictions where such activity would be unlawful.
All content is of a general nature and may not address the specific circumstances of any individual or entity. It is not a substitute for professional advice or services. Any actions you take based on the information provided here are strictly at your own risk. You accept full responsibility for any decisions or outcomes arising from your use of this website and agree to release us from any liability in connection with your use of, or reliance upon, the content or products found herein.