
|
Glanbia plc (GL9.ir) DCF -Bewertung |
Fully Editable: Tailor To Your Needs In Excel Or Sheets
Professional Design: Trusted, Industry-Standard Templates
Investor-Approved Valuation Models
MAC/PC Compatible, Fully Unlocked
No Expertise Is Needed; Easy To Follow
Glanbia plc (GL9.IR) Bundle
Verbessern Sie Ihre Anlagestrategie mit dem DCF -Taschenrechner von Glanbia Plc (GL9IR)! Erforschen Sie authentische Finanzdaten, passen Sie Wachstumsprognosen und -kosten an und beobachten Sie sofort, wie diese Modifikationen den inneren Wert von Glanbia plc (GL9IR) beeinflussen.
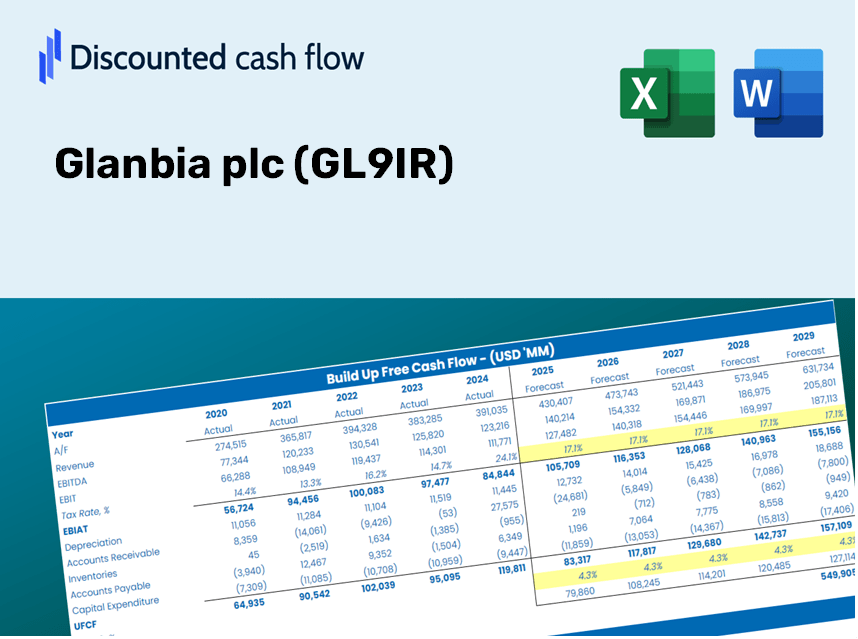
Discounted Cash Flow (DCF) - (USD MM)
| Year | AY1 2020 |
AY2 2021 |
AY3 2022 |
AY4 2023 |
AY5 2024 |
FY1 2025 |
FY2 2026 |
FY3 2027 |
FY4 2028 |
FY5 2029 |
|---|---|---|---|---|---|---|---|---|---|---|
| Revenue | 3,297.3 | 3,619.7 | 4,866.4 | 4,328.1 | 3,311.6 | 3,337.9 | 3,364.5 | 3,391.2 | 3,418.2 | 3,445.4 |
| Revenue Growth, % | 0 | 9.78 | 34.44 | -11.06 | -23.49 | 0.79517 | 0.79517 | 0.79517 | 0.79517 | 0.79517 |
| EBITDA | 264.3 | 247.4 | 321.9 | 483.5 | 417.0 | 301.9 | 304.3 | 306.7 | 309.2 | 311.6 |
| EBITDA, % | 8.01 | 6.83 | 6.61 | 11.17 | 12.59 | 9.04 | 9.04 | 9.04 | 9.04 | 9.04 |
| Depreciation | 107.6 | 109.4 | 122.9 | 128.5 | 85.5 | 95.9 | 96.6 | 97.4 | 98.2 | 99.0 |
| Depreciation, % | 3.26 | 3.02 | 2.53 | 2.97 | 2.58 | 2.87 | 2.87 | 2.87 | 2.87 | 2.87 |
| EBIT | 156.6 | 137.9 | 199.0 | 355.0 | 331.5 | 206.0 | 207.7 | 209.3 | 211.0 | 212.7 |
| EBIT, % | 4.75 | 3.81 | 4.09 | 8.2 | 10.01 | 6.17 | 6.17 | 6.17 | 6.17 | 6.17 |
| Total Cash | 141.7 | 199.2 | 378.3 | 356.8 | 359.6 | 244.9 | 246.8 | 248.8 | 250.8 | 252.7 |
| Total Cash, percent | .0 | .0 | .0 | .0 | .0 | .0 | .0 | .0 | .0 | .0 |
| Account Receivables | 241.3 | 276.9 | 321.6 | 384.1 | 310.9 | 266.0 | 268.1 | 270.2 | 272.4 | 274.5 |
| Account Receivables, % | 7.32 | 7.65 | 6.61 | 8.88 | 9.39 | 7.97 | 7.97 | 7.97 | 7.97 | 7.97 |
| Inventories | 325.7 | 512.0 | 606.9 | 474.5 | 547.5 | 427.2 | 430.6 | 434.0 | 437.5 | 440.9 |
| Inventories, % | 9.88 | 14.14 | 12.47 | 10.96 | 16.53 | 12.8 | 12.8 | 12.8 | 12.8 | 12.8 |
| Accounts Payable | 224.5 | 381.6 | 332.0 | 241.7 | 297.2 | 258.6 | 260.6 | 262.7 | 264.8 | 266.9 |
| Accounts Payable, % | 6.81 | 10.54 | 6.82 | 5.58 | 8.97 | 7.75 | 7.75 | 7.75 | 7.75 | 7.75 |
| Capital Expenditure | -55.4 | -66.8 | -59.4 | -59.2 | -75.1 | -56.0 | -56.4 | -56.9 | -57.3 | -57.8 |
| Capital Expenditure, % | -1.68 | -1.85 | -1.22 | -1.37 | -2.27 | -1.68 | -1.68 | -1.68 | -1.68 | -1.68 |
| Tax Rate, % | 20.82 | 20.82 | 20.82 | 20.82 | 20.82 | 20.82 | 20.82 | 20.82 | 20.82 | 20.82 |
| EBITAT | 177.4 | 165.0 | 176.3 | 321.1 | 262.5 | 188.8 | 190.3 | 191.8 | 193.4 | 194.9 |
| Depreciation | ||||||||||
| Changes in Account Receivables | ||||||||||
| Changes in Inventories | ||||||||||
| Changes in Accounts Payable | ||||||||||
| Capital Expenditure | ||||||||||
| UFCF | -112.8 | 143.0 | 50.4 | 369.9 | 328.6 | 355.4 | 227.1 | 228.9 | 230.7 | 232.6 |
| WACC, % | 5.44 | 5.44 | 5.37 | 5.38 | 5.31 | 5.39 | 5.39 | 5.39 | 5.39 | 5.39 |
| PV UFCF | ||||||||||
| SUM PV UFCF | 1,103.2 | |||||||||
| Long Term Growth Rate, % | 3.00 | |||||||||
| Free cash flow (T + 1) | 240 | |||||||||
| Terminal Value | 10,032 | |||||||||
| Present Terminal Value | 7,717 | |||||||||
| Enterprise Value | 8,820 | |||||||||
| Net Debt | 467 | |||||||||
| Equity Value | 8,353 | |||||||||
| Diluted Shares Outstanding, MM | 265 | |||||||||
| Equity Value Per Share | 31.49 |
What You Will Receive
- Genuine Glanbia Data: Preloaded financial information – ranging from revenue to EBIT – based on actual and forecasted numbers.
- Comprehensive Customization: Modify all essential parameters (yellow cells) such as WACC, growth rates, and tax percentages.
- Real-Time Valuation Updates: Automatic recalibrations to assess the impact of changes on Glanbia’s fair value.
- Flexible Excel Template: Designed for quick modifications, scenario analysis, and in-depth projections.
- Efficient and Precise: Eliminate the need to build models from the ground up while ensuring accuracy and adaptability.
Key Features
- Comprehensive Glanbia Data: Pre-loaded with Glanbia plc's historical financial performance and future projections.
- Fully Adjustable Parameters: Tailor revenue growth, profit margins, WACC, tax rates, and capital expenditures to fit your analysis.
- Responsive Valuation Model: Instantaneous updates to Net Present Value (NPV) and intrinsic value based on your customized inputs.
- Scenario Analysis: Develop various forecasting scenarios to evaluate different valuation results.
- Intuitive Interface: Clean, organized design suitable for both experienced professionals and newcomers.
How It Operates
- 1. Access the Template: Download and open the Excel file containing Glanbia plc’s preloaded data.
- 2. Adjust Assumptions: Modify essential inputs such as growth rates, WACC, and capital expenditures.
- 3. See Results in Real-Time: The DCF model automatically calculates intrinsic value and NPV.
- 4. Explore Scenarios: Analyze various forecasts to evaluate different valuation results.
- 5. Present with Assurance: Share professional valuation insights to back your decisions regarding Glanbia plc (GL9IR).
Why Choose the Glanbia plc (GL9IR) Calculator?
- Accuracy: Utilizes genuine Glanbia financial data to ensure precise results.
- Flexibility: Tailored for users to freely experiment and adjust input variables.
- Time-Saving: Eliminate the need to construct a DCF model from the ground up.
- Professional-Grade: Crafted with the expertise and usability expected at the CFO level.
- User-Friendly: Intuitive design makes it accessible for users without extensive financial modeling expertise.
Who Should Use This Product?
- Finance Students: Master valuation techniques and practice them with real-world data.
- Academics: Integrate industry-standard models into your academic programs or research projects.
- Investors: Evaluate your hypotheses and analyze valuation results for Glanbia plc (GL9IR) stock.
- Analysts: Enhance your efficiency with a ready-to-use, customizable DCF model.
- Small Business Owners: Understand how major public companies like Glanbia plc (GL9IR) are appraised.
Contents of the Template
- Pre-Filled DCF Model: Glanbia plc’s financial data preloaded for immediate application.
- WACC Calculator: Comprehensive calculations for Weighted Average Cost of Capital.
- Financial Ratios: Assess Glanbia plc’s profitability, leverage, and operational efficiency.
- Editable Inputs: Customize assumptions such as growth rates, margins, and CAPEX to suit your analysis.
- Financial Statements: Annual and quarterly reports available for in-depth evaluation.
- Interactive Dashboard: Effortlessly visualize key valuation metrics and outcomes.
Disclaimer
All information, articles, and product details provided on this website are for general informational and educational purposes only. We do not claim any ownership over, nor do we intend to infringe upon, any trademarks, copyrights, logos, brand names, or other intellectual property mentioned or depicted on this site. Such intellectual property remains the property of its respective owners, and any references here are made solely for identification or informational purposes, without implying any affiliation, endorsement, or partnership.
We make no representations or warranties, express or implied, regarding the accuracy, completeness, or suitability of any content or products presented. Nothing on this website should be construed as legal, tax, investment, financial, medical, or other professional advice. In addition, no part of this site—including articles or product references—constitutes a solicitation, recommendation, endorsement, advertisement, or offer to buy or sell any securities, franchises, or other financial instruments, particularly in jurisdictions where such activity would be unlawful.
All content is of a general nature and may not address the specific circumstances of any individual or entity. It is not a substitute for professional advice or services. Any actions you take based on the information provided here are strictly at your own risk. You accept full responsibility for any decisions or outcomes arising from your use of this website and agree to release us from any liability in connection with your use of, or reliance upon, the content or products found herein.