
|
DLAND Pharma Limited (Drüsen) DCF -Bewertung |
Fully Editable: Tailor To Your Needs In Excel Or Sheets
Professional Design: Trusted, Industry-Standard Templates
Investor-Approved Valuation Models
MAC/PC Compatible, Fully Unlocked
No Expertise Is Needed; Easy To Follow
Gland Pharma Limited (GLAND.NS) Bundle
Verbessern Sie Ihre Anlagestrategien mit dem DCF -Taschenrechner des DLAND Pharma Limited (DLANDNS)! Sehen Sie sich authentische Finanzdaten an, passen Sie Wachstumsprojektionen und -kosten an und beobachten Sie sofort, wie sich diese Modifikationen auf den inneren Wert von Drüsen -Pharma -Limited (DLANDNS) auswirken.
Discounted Cash Flow (DCF) - (USD MM)
| Year | AY1 2021 |
AY2 2022 |
AY3 2023 |
AY4 2024 |
AY5 2025 |
FY1 2026 |
FY2 2027 |
FY3 2028 |
FY4 2029 |
FY5 2030 |
|---|---|---|---|---|---|---|---|---|---|---|
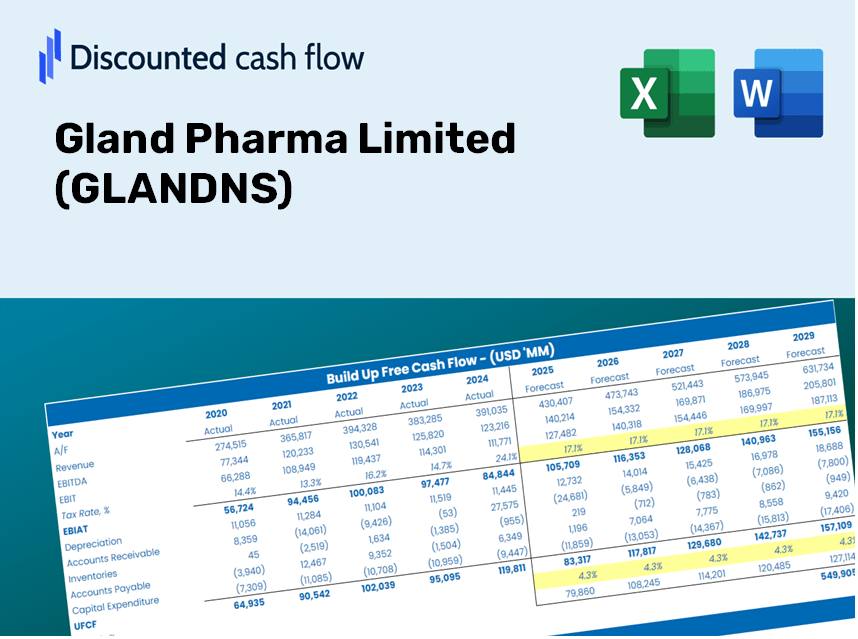
| Revenue | 34,628.8 | 44,007.1 | 36,246.0 | 56,647.2 | 56,165.0 | 65,275.1 | 75,862.8 | 88,167.9 | 102,468.9 | 119,089.6 |
| Revenue Growth, % | 0 | 27.08 | -17.64 | 56.29 | -0.8512 | 16.22 | 16.22 | 16.22 | 16.22 | 16.22 |
| EBITDA | 13,020.2 | 15,101.5 | 10,310.0 | 12,968.1 | 12,314.0 | 18,952.9 | 22,027.1 | 25,600.0 | 29,752.3 | 34,578.2 |
| EBITDA, % | 37.6 | 34.32 | 28.44 | 22.89 | 21.92 | 29.04 | 29.04 | 29.04 | 29.04 | 29.04 |
| Depreciation | 985.8 | 1,101.2 | 1,465.6 | 3,253.4 | 3,592.7 | 2,811.0 | 3,267.0 | 3,796.9 | 4,412.8 | 5,128.5 |
| Depreciation, % | 2.85 | 2.5 | 4.04 | 5.74 | 6.4 | 4.31 | 4.31 | 4.31 | 4.31 | 4.31 |
| EBIT | 12,034.5 | 14,000.3 | 8,844.4 | 9,714.7 | 8,721.3 | 16,141.9 | 18,760.1 | 21,803.1 | 25,339.6 | 29,449.7 |
| EBIT, % | 34.75 | 31.81 | 24.4 | 17.15 | 15.53 | 24.73 | 24.73 | 24.73 | 24.73 | 24.73 |
| Total Cash | 30,031.5 | 32,427.2 | 37,628.3 | 19,387.5 | 29,521.9 | 45,326.8 | 52,678.9 | 61,223.5 | 71,154.0 | 82,695.4 |
| Total Cash, percent | .0 | .0 | .0 | .0 | .0 | .0 | .0 | .0 | .0 | .0 |
| Account Receivables | 7,444.7 | 12,927.5 | 10,359.7 | 16,482.1 | 15,165.3 | 17,696.5 | 20,567.0 | 23,903.0 | 27,780.1 | 32,286.0 |
| Account Receivables, % | 21.5 | 29.38 | 28.58 | 29.1 | 27 | 27.11 | 27.11 | 27.11 | 27.11 | 27.11 |
| Inventories | 12,881.7 | 12,291.9 | 19,781.9 | 16,763.3 | 16,852.2 | 23,408.3 | 27,205.1 | 31,617.9 | 36,746.3 | 42,706.7 |
| Inventories, % | 37.2 | 27.93 | 54.58 | 29.59 | 30 | 35.86 | 35.86 | 35.86 | 35.86 | 35.86 |
| Accounts Payable | 3,963.5 | 4,628.5 | 5,873.5 | 8,626.9 | 8,204.1 | 8,878.0 | 10,318.0 | 11,991.6 | 13,936.6 | 16,197.2 |
| Accounts Payable, % | 11.45 | 10.52 | 16.2 | 15.23 | 14.61 | 13.6 | 13.6 | 13.6 | 13.6 | 13.6 |
| Capital Expenditure | -2,287.8 | -5,221.2 | -2,231.2 | -3,899.3 | -3,845.4 | -5,007.5 | -5,819.7 | -6,763.7 | -7,860.8 | -9,135.8 |
| Capital Expenditure, % | -6.61 | -11.86 | -6.16 | -6.88 | -6.85 | -7.67 | -7.67 | -7.67 | -7.67 | -7.67 |
| Tax Rate, % | 34.27 | 34.27 | 34.27 | 34.27 | 34.27 | 34.27 | 34.27 | 34.27 | 34.27 | 34.27 |
| EBITAT | 8,988.5 | 10,480.8 | 6,550.3 | 6,626.0 | 5,732.8 | 11,543.1 | 13,415.5 | 15,591.5 | 18,120.4 | 21,059.6 |
| Depreciation | ||||||||||
| Changes in Account Receivables | ||||||||||
| Changes in Inventories | ||||||||||
| Changes in Accounts Payable | ||||||||||
| Capital Expenditure | ||||||||||
| UFCF | -8,676.3 | 2,132.7 | 2,107.5 | 5,629.7 | 6,285.2 | 933.2 | 5,635.5 | 6,549.6 | 7,611.9 | 8,846.6 |
| WACC, % | 5.52 | 5.52 | 5.52 | 5.52 | 5.52 | 5.52 | 5.52 | 5.52 | 5.52 | 5.52 |
| PV UFCF | ||||||||||
| SUM PV UFCF | 24,422.4 | |||||||||
| Long Term Growth Rate, % | 3.00 | |||||||||
| Free cash flow (T + 1) | 9,112 | |||||||||
| Terminal Value | 361,591 | |||||||||
| Present Terminal Value | 276,404 | |||||||||
| Enterprise Value | 300,827 | |||||||||
| Net Debt | -22,425 | |||||||||
| Equity Value | 323,251 | |||||||||
| Diluted Shares Outstanding, MM | 165 | |||||||||
| Equity Value Per Share | 1,962.12 |
What You Will Receive
- Authentic Gland Pharma Data: Comprehensive financials – from revenue to EBIT – derived from actual and projected figures.
- Complete Customization: Modify all essential parameters (yellow cells) such as WACC, growth %, and tax rates.
- Immediate Valuation Updates: Automatic recalibrations to assess the impact of changes on Gland Pharma's fair value.
- Flexible Excel Template: Designed for quick modifications, scenario analysis, and in-depth projections.
- Efficient and Precise: Eliminate the need to build models from the ground up while ensuring accuracy and adaptability.
Key Features
- Comprehensive DCF Calculator: Features detailed unlevered and levered DCF valuation models tailored for Gland Pharma Limited (GLANDNS).
- WACC Calculator: Pre-built Weighted Average Cost of Capital worksheet with customizable parameters for Gland Pharma Limited (GLANDNS).
- Adjustable Forecast Assumptions: Easily update growth rates, capital expenditures, and discount rates specific to Gland Pharma Limited (GLANDNS).
- Integrated Financial Ratios: Evaluate profitability, leverage, and efficiency ratios relevant to Gland Pharma Limited (GLANDNS).
- Interactive Dashboard and Charts: Visual representations summarizing key valuation metrics for straightforward analysis of Gland Pharma Limited (GLANDNS).
How It Functions
- Download the Template: Gain immediate access to the Excel-based GLANDNS DCF Calculator.
- Enter Your Assumptions: Modify the yellow-highlighted cells for growth rates, WACC, margins, and other parameters.
- Get Instant Calculations: The model will automatically refresh Gland Pharma’s intrinsic value.
- Experiment with Scenarios: Run various assumptions to assess potential valuation shifts.
- Evaluate and Decide: Utilize the findings to inform your investment or financial analysis decisions.
Why Choose the Gland Pharma Calculator?
- User-Friendly Interface: Perfectly tailored for both novices and seasoned professionals.
- Customizable Inputs: Modify parameters effortlessly to suit your analytical needs.
- Real-Time Adjustments: Observe immediate updates to Gland Pharma's valuation as you tweak inputs.
- Pre-Loaded Data: Comes with Gland Pharma’s actual financial figures for swift analysis.
- Favored by Experts: Widely utilized by investors and analysts for making data-driven decisions.
Who Can Benefit from Gland Pharma Limited (GLANDNS)?
- Investors: Evaluate Gland Pharma’s valuation prior to making stock transactions.
- CFOs and Financial Analysts: Optimize valuation workflows and assess financial forecasts.
- Startup Founders: Discover how major public firms like Gland Pharma are appraised.
- Consultants: Provide detailed valuation reports to clients.
- Students and Educators: Utilize real market data to practice and teach valuation methodologies.
Contents of the Template
- Operating and Balance Sheet Data: Pre-filled historical data and forecasts for Gland Pharma Limited (GLANDNS), including revenue, EBITDA, EBIT, and capital expenditures.
- WACC Calculation: A dedicated sheet for calculating the Weighted Average Cost of Capital (WACC), featuring parameters such as Beta, risk-free rate, and share price.
- DCF Valuation (Unlevered and Levered): Customizable Discounted Cash Flow models displaying the intrinsic value with comprehensive calculations.
- Financial Statements: Pre-loaded annual and quarterly financial statements to facilitate thorough analysis.
- Key Ratios: Provides profitability, leverage, and efficiency ratios specific to Gland Pharma Limited (GLANDNS).
- Dashboard and Charts: A visual overview of valuation results and underlying assumptions for easy analysis of outcomes.
Disclaimer
All information, articles, and product details provided on this website are for general informational and educational purposes only. We do not claim any ownership over, nor do we intend to infringe upon, any trademarks, copyrights, logos, brand names, or other intellectual property mentioned or depicted on this site. Such intellectual property remains the property of its respective owners, and any references here are made solely for identification or informational purposes, without implying any affiliation, endorsement, or partnership.
We make no representations or warranties, express or implied, regarding the accuracy, completeness, or suitability of any content or products presented. Nothing on this website should be construed as legal, tax, investment, financial, medical, or other professional advice. In addition, no part of this site—including articles or product references—constitutes a solicitation, recommendation, endorsement, advertisement, or offer to buy or sell any securities, franchises, or other financial instruments, particularly in jurisdictions where such activity would be unlawful.
All content is of a general nature and may not address the specific circumstances of any individual or entity. It is not a substitute for professional advice or services. Any actions you take based on the information provided here are strictly at your own risk. You accept full responsibility for any decisions or outcomes arising from your use of this website and agree to release us from any liability in connection with your use of, or reliance upon, the content or products found herein.