
|
Goldmining Inc. (GLDG) DCF -Bewertung |
Fully Editable: Tailor To Your Needs In Excel Or Sheets
Professional Design: Trusted, Industry-Standard Templates
Investor-Approved Valuation Models
MAC/PC Compatible, Fully Unlocked
No Expertise Is Needed; Easy To Follow
GoldMining Inc. (GLDG) Bundle
Entdecken Sie die finanzielle Zukunft von Goldmining Inc. (GLDG) mit unserem benutzerfreundlichen DCF-Taschenrechner! Geben Sie Ihre Annahmen für Wachstum, Margen und Ausgaben ein, um Goldmining Inc. (GLDG) intrinsischer Wert zu berechnen und Ihre Anlagestrategie zu verbessern.
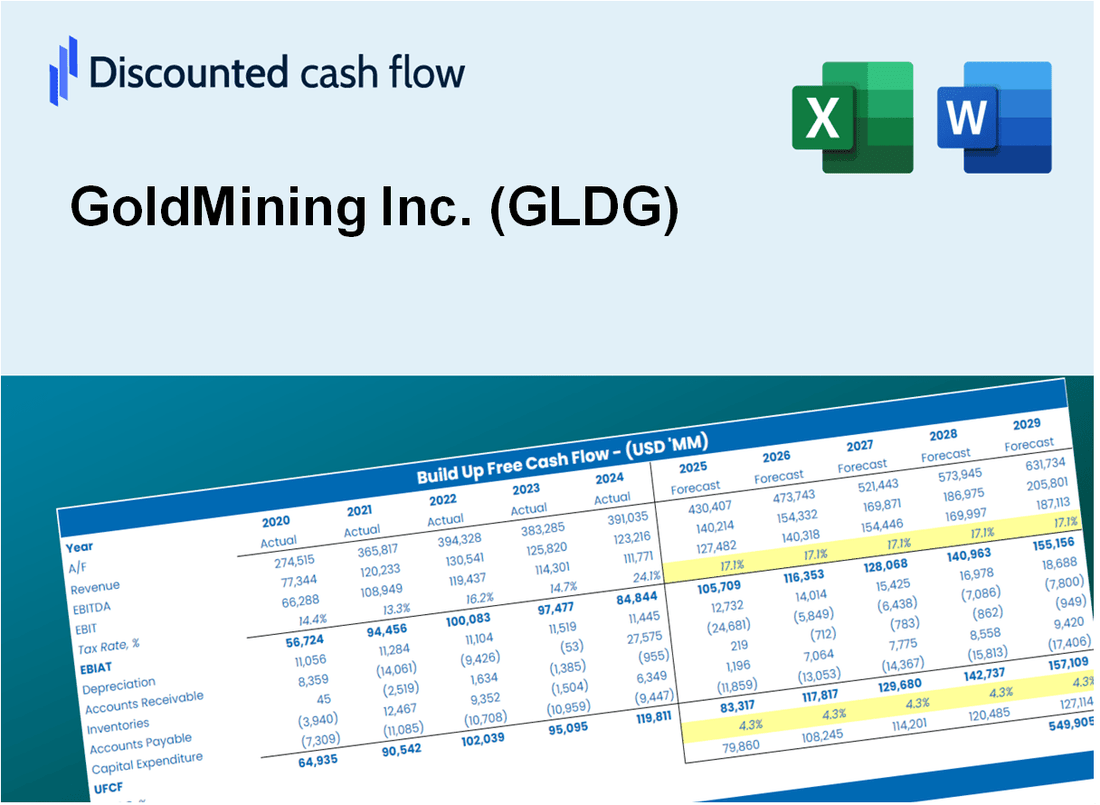
Discounted Cash Flow (DCF) - (USD MM)
| Year | AY1 2020 |
AY2 2021 |
AY3 2022 |
AY4 2023 |
AY5 2024 |
FY1 2025 |
FY2 2026 |
FY3 2027 |
FY4 2028 |
FY5 2029 |
|---|---|---|---|---|---|---|---|---|---|---|
| Revenue | .0 | .0 | .0 | .0 | .0 | .0 | .0 | .0 | .0 | .0 |
| Revenue Growth, % | 0 | 0 | 0 | 0 | 0 | 0 | 0 | 0 | 0 | 0 |
| EBITDA | -7.7 | -8.0 | -8.9 | -17.0 | -16.6 | .0 | .0 | .0 | .0 | .0 |
| EBITDA, % | 100 | 100 | 100 | 100 | 100 | 100 | 100 | 100 | 100 | 100 |
| Depreciation | .2 | .1 | .2 | .2 | .2 | .0 | .0 | .0 | .0 | .0 |
| Depreciation, % | 100 | 100 | 100 | 100 | 100 | 100 | 100 | 100 | 100 | 100 |
| EBIT | -7.9 | -8.1 | -9.0 | -17.2 | -16.8 | .0 | .0 | .0 | .0 | .0 |
| EBIT, % | 100 | 100 | 100 | 100 | 100 | 100 | 100 | 100 | 100 | 100 |
| Total Cash | 6.6 | 8.3 | 6.0 | 15.4 | 8.5 | .0 | .0 | .0 | .0 | .0 |
| Total Cash, percent | .0 | .0 | .0 | .0 | .0 | .0 | .0 | .0 | .0 | .0 |
| Account Receivables | .0 | .0 | .3 | .4 | .3 | .0 | .0 | .0 | .0 | .0 |
| Account Receivables, % | 100 | 100 | 100 | 100 | 100 | 100 | 100 | 100 | 100 | 100 |
| Inventories | .2 | .0 | .0 | .0 | .0 | .0 | .0 | .0 | .0 | .0 |
| Inventories, % | 100 | 100 | 100 | 100 | 100 | 100 | 100 | 100 | 100 | 100 |
| Accounts Payable | .7 | .7 | 1.2 | 1.3 | 1.1 | .0 | .0 | .0 | .0 | .0 |
| Accounts Payable, % | 100 | 100 | 100 | 100 | 100 | 100 | 100 | 100 | 100 | 100 |
| Capital Expenditure | -.7 | .0 | -.1 | -1.3 | -.5 | .0 | .0 | .0 | .0 | .0 |
| Capital Expenditure, % | 100 | 100 | 100 | 100 | 100 | 0 | 0 | 0 | 0 | 0 |
| Tax Rate, % | -0.16636 | -0.16636 | -0.16636 | -0.16636 | -0.16636 | -0.16636 | -0.16636 | -0.16636 | -0.16636 | -0.16636 |
| EBITAT | -7.9 | -7.5 | -8.3 | -19.3 | -16.9 | .0 | .0 | .0 | .0 | .0 |
| Depreciation | ||||||||||
| Changes in Account Receivables | ||||||||||
| Changes in Inventories | ||||||||||
| Changes in Accounts Payable | ||||||||||
| Capital Expenditure | ||||||||||
| UFCF | -8.0 | -7.1 | -7.9 | -20.6 | -17.0 | -.9 | .0 | .0 | .0 | .0 |
| WACC, % | 10.41 | 10.41 | 10.41 | 10.41 | 10.41 | 10.41 | 10.41 | 10.41 | 10.41 | 10.41 |
| PV UFCF | ||||||||||
| SUM PV UFCF | -.8 | |||||||||
| Long Term Growth Rate, % | 2.00 | |||||||||
| Free cash flow (T + 1) | 0 | |||||||||
| Terminal Value | 0 | |||||||||
| Present Terminal Value | 0 | |||||||||
| Enterprise Value | -1 | |||||||||
| Net Debt | -8 | |||||||||
| Equity Value | 7 | |||||||||
| Diluted Shares Outstanding, MM | 188 | |||||||||
| Equity Value Per Share | 0.04 |
What You Will Receive
- Customizable Excel Template: A fully editable Excel-based DCF Calculator featuring pre-filled financial data for GoldMining Inc. (GLDG).
- Comprehensive Data: Historical performance metrics and future estimates (highlighted in the yellow cells).
- Adjustable Forecasts: Modify key assumptions such as revenue growth, EBITDA %, and WACC.
- Instant Calculations: Quickly assess how your inputs affect GoldMining's valuation.
- Professional Resource: Designed for investors, CFOs, consultants, and financial analysts.
- User-Friendly Interface: Organized for ease of understanding and navigation, complete with step-by-step guidance.
Key Features
- 🔍 Real-Life GLDG Financials: Pre-filled historical and projected data for GoldMining Inc.
- ✏️ Fully Customizable Inputs: Adjust all critical parameters (yellow cells) such as WACC, growth %, and tax rates.
- 📊 Professional DCF Valuation: Built-in formulas calculate GoldMining’s intrinsic value using the Discounted Cash Flow method.
- ⚡ Instant Results: Visualize GoldMining’s valuation instantly after making changes.
- Scenario Analysis: Test and compare outcomes for various financial assumptions side-by-side.
How It Works
- Step 1: Download the Excel file.
- Step 2: Review GoldMining Inc.'s (GLDG) pre-filled financial data and forecasts.
- Step 3: Modify key inputs such as gold production estimates, operating costs, and discount rates (highlighted cells).
- Step 4: Observe the DCF model update in real-time as you adjust your assumptions.
- Step 5: Evaluate the results and apply the findings to your investment strategy.
Why Choose GoldMining Inc. (GLDG)?
- Comprehensive Resource: Offers extensive insights into gold mining operations and market dynamics.
- Tailored Analysis: Customize your investment strategy based on highlighted market indicators.
- In-Depth Evaluations: Provides detailed assessments of GoldMining Inc.'s asset value and growth potential.
- Up-to-Date Information: Access to current and projected data for informed decision-making.
- Expert-Level Insights: Perfect for investors, analysts, and industry professionals seeking reliable information.
Who Should Use GoldMining Inc. (GLDG)?
- Investors: Gain insights into gold market trends and make informed investment choices.
- Financial Analysts: Utilize comprehensive data to enhance your analysis of mining operations.
- Consultants: Tailor reports and presentations using GoldMining Inc.'s detailed performance metrics.
- Mining Enthusiasts: Explore the intricacies of the gold mining sector with real-time data and case studies.
- Educators and Students: Leverage this resource as a valuable teaching aid in mining and finance courses.
What the Template Contains
- Pre-Filled DCF Model: GoldMining Inc.’s (GLDG) financial data preloaded for immediate use.
- WACC Calculator: Detailed calculations for Weighted Average Cost of Capital.
- Financial Ratios: Evaluate GoldMining Inc.’s (GLDG) profitability, leverage, and efficiency.
- Editable Inputs: Change assumptions such as growth, margins, and CAPEX to fit your scenarios.
- Financial Statements: Annual and quarterly reports to support detailed analysis.
- Interactive Dashboard: Easily visualize key valuation metrics and results.
Disclaimer
All information, articles, and product details provided on this website are for general informational and educational purposes only. We do not claim any ownership over, nor do we intend to infringe upon, any trademarks, copyrights, logos, brand names, or other intellectual property mentioned or depicted on this site. Such intellectual property remains the property of its respective owners, and any references here are made solely for identification or informational purposes, without implying any affiliation, endorsement, or partnership.
We make no representations or warranties, express or implied, regarding the accuracy, completeness, or suitability of any content or products presented. Nothing on this website should be construed as legal, tax, investment, financial, medical, or other professional advice. In addition, no part of this site—including articles or product references—constitutes a solicitation, recommendation, endorsement, advertisement, or offer to buy or sell any securities, franchises, or other financial instruments, particularly in jurisdictions where such activity would be unlawful.
All content is of a general nature and may not address the specific circumstances of any individual or entity. It is not a substitute for professional advice or services. Any actions you take based on the information provided here are strictly at your own risk. You accept full responsibility for any decisions or outcomes arising from your use of this website and agree to release us from any liability in connection with your use of, or reliance upon, the content or products found herein.