
|
Galmed Pharmaceuticals Ltd. (GLMD) DCF -Bewertung |
Fully Editable: Tailor To Your Needs In Excel Or Sheets
Professional Design: Trusted, Industry-Standard Templates
Investor-Approved Valuation Models
MAC/PC Compatible, Fully Unlocked
No Expertise Is Needed; Easy To Follow
Galmed Pharmaceuticals Ltd. (GLMD) Bundle
Gewinnen Sie einen Einblick in Ihre Galmed Pharmaceuticals Ltd. (GLMD) Bewertungsanalyse unter Verwendung unseres hochmodernen DCF-Taschenrechners! Diese Excel -Vorlage, die mit realen GLMD -Daten vorinstalliert ist, ermöglicht es Ihnen, die Prognosen und Annahmen so anzupassen, dass der intrinsische Wert von Galmed Pharmaceuticals Ltd. genau bestimmt wird.
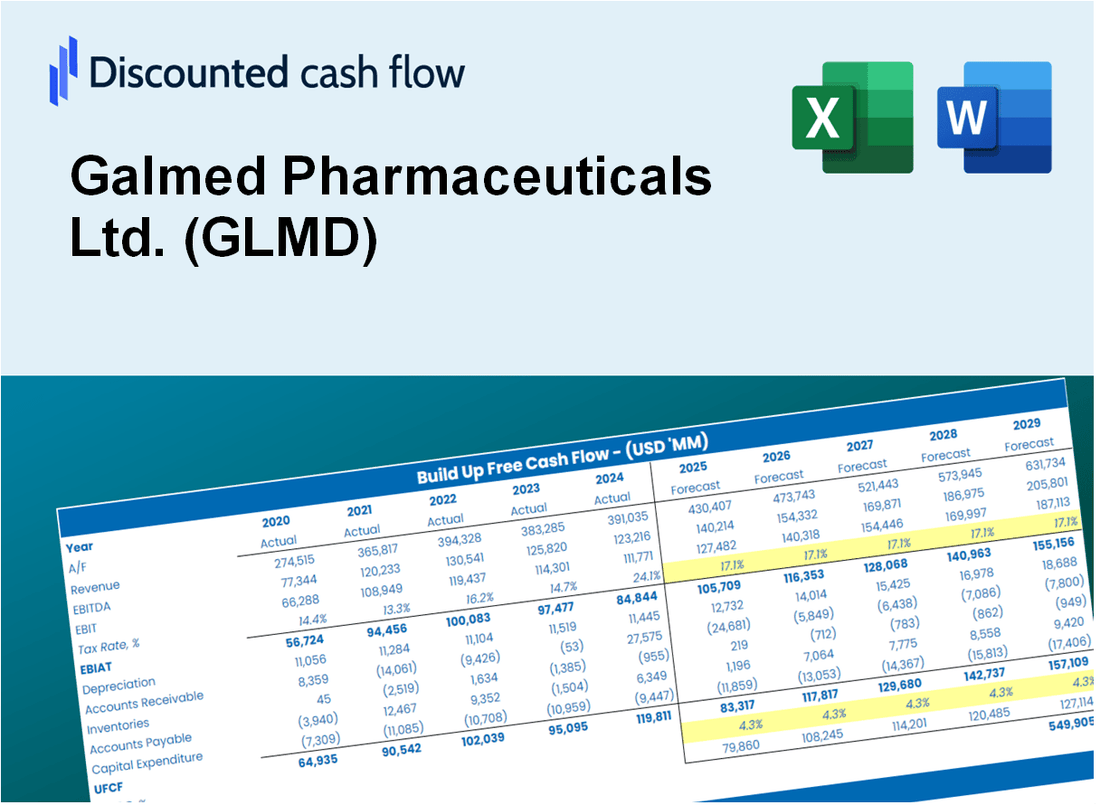
Discounted Cash Flow (DCF) - (USD MM)
| Year | AY1 2020 |
AY2 2021 |
AY3 2022 |
AY4 2023 |
AY5 2024 |
FY1 2025 |
FY2 2026 |
FY3 2027 |
FY4 2028 |
FY5 2029 |
|---|---|---|---|---|---|---|---|---|---|---|
| Revenue | .0 | .0 | .0 | .0 | .0 | .0 | .0 | .0 | .0 | .0 |
| Revenue Growth, % | 0 | 0 | 0 | 0 | 0 | 0 | 0 | 0 | 0 | 0 |
| EBITDA | -30.2 | -32.8 | -17.6 | -6.9 | -7.4 | .0 | .0 | .0 | .0 | .0 |
| EBITDA, % | 100 | 100 | 100 | 100 | 100 | 100 | 100 | 100 | 100 | 100 |
| Depreciation | .0 | .0 | .0 | .0 | .1 | .0 | .0 | .0 | .0 | .0 |
| Depreciation, % | 100 | 100 | 100 | 100 | 100 | 100 | 100 | 100 | 100 | 100 |
| EBIT | -30.2 | -32.9 | -17.7 | -6.9 | -7.5 | .0 | .0 | .0 | .0 | .0 |
| EBIT, % | 100 | 100 | 100 | 100 | 100 | 100 | 100 | 100 | 100 | 100 |
| Total Cash | 50.9 | 34.8 | 13.8 | 12.6 | 15.3 | .0 | .0 | .0 | .0 | .0 |
| Total Cash, percent | .0 | .0 | .0 | .0 | .0 | .0 | .0 | .0 | .0 | .0 |
| Account Receivables | .1 | .1 | .0 | .2 | .2 | .0 | .0 | .0 | .0 | .0 |
| Account Receivables, % | 100 | 100 | 100 | 100 | 100 | 100 | 100 | 100 | 100 | 100 |
| Inventories | -3.8 | -.9 | .1 | .0 | .0 | .0 | .0 | .0 | .0 | .0 |
| Inventories, % | 100 | 100 | 100 | 100 | 100 | 100 | 100 | 100 | 100 | 100 |
| Accounts Payable | 7.0 | 4.9 | 2.6 | 1.9 | 1.3 | .0 | .0 | .0 | .0 | .0 |
| Accounts Payable, % | 100 | 100 | 100 | 100 | 100 | 100 | 100 | 100 | 100 | 100 |
| Capital Expenditure | .0 | .0 | .0 | .0 | .0 | .0 | .0 | .0 | .0 | .0 |
| Capital Expenditure, % | 100 | 100 | 100 | 100 | 100 | 0 | 0 | 0 | 0 | 0 |
| Tax Rate, % | 0 | 0 | 0 | 0 | 0 | 0 | 0 | 0 | 0 | 0 |
| EBITAT | -29.0 | -32.4 | -18.3 | -6.9 | -7.5 | .0 | .0 | .0 | .0 | .0 |
| Depreciation | ||||||||||
| Changes in Account Receivables | ||||||||||
| Changes in Inventories | ||||||||||
| Changes in Accounts Payable | ||||||||||
| Capital Expenditure | ||||||||||
| UFCF | -18.2 | -37.4 | -21.6 | -7.6 | -8.0 | -1.1 | .0 | .0 | .0 | .0 |
| WACC, % | 6.07 | 6.07 | 6.07 | 6.07 | 6.07 | 6.07 | 6.07 | 6.07 | 6.07 | 6.07 |
| PV UFCF | ||||||||||
| SUM PV UFCF | -1.0 | |||||||||
| Long Term Growth Rate, % | 2.00 | |||||||||
| Free cash flow (T + 1) | 0 | |||||||||
| Terminal Value | 0 | |||||||||
| Present Terminal Value | 0 | |||||||||
| Enterprise Value | -1 | |||||||||
| Net Debt | -5 | |||||||||
| Equity Value | 4 | |||||||||
| Diluted Shares Outstanding, MM | 1 | |||||||||
| Equity Value Per Share | 3.88 |
What You Will Get
- Real GLMD Financial Data: Pre-filled with Galmed Pharmaceuticals’ historical and projected data for precise analysis.
- Fully Editable Template: Modify key inputs like revenue growth, WACC, and EBITDA % with ease.
- Automatic Calculations: See Galmed Pharmaceuticals’ intrinsic value update instantly based on your changes.
- Professional Valuation Tool: Designed for investors, analysts, and consultants seeking accurate DCF results.
- User-Friendly Design: Simple structure and clear instructions for all experience levels.
Key Features
- 🔍 Real-Life GLMD Financials: Pre-filled historical and projected data for Galmed Pharmaceuticals Ltd.
- ✏️ Fully Customizable Inputs: Adjust all critical parameters (yellow cells) like WACC, growth %, and tax rates.
- 📊 Professional DCF Valuation: Built-in formulas calculate Galmed’s intrinsic value using the Discounted Cash Flow method.
- ⚡ Instant Results: Visualize Galmed’s valuation instantly after making changes.
- Scenario Analysis: Test and compare outcomes for various financial assumptions side-by-side.
How It Works
- Download: Obtain the pre-prepared Excel file containing Galmed Pharmaceuticals Ltd.'s (GLMD) financial data.
- Customize: Modify projections, such as revenue growth, EBITDA %, and WACC.
- Update Automatically: The intrinsic value and NPV calculations refresh in real-time.
- Test Scenarios: Generate various projections and instantly compare the results.
- Make Decisions: Leverage the valuation outcomes to inform your investment choices.
Why Choose Galmed Pharmaceuticals Ltd. (GLMD) Calculator?
- Accuracy: Utilizes real Galmed financial data for precise calculations.
- Flexibility: Tailored for users to easily adjust and experiment with inputs.
- Time-Saving: Avoid the complexities of creating a financial model from the ground up.
- Professional-Grade: Crafted with the expertise and precision expected at the CFO level.
- User-Friendly: Intuitive interface designed for all users, regardless of financial modeling skills.
Who Should Use This Product?
- Pharmaceutical Students: Explore drug development processes and apply them using real market data.
- Researchers: Integrate advanced models into studies or academic projects related to drug efficacy.
- Investors: Validate your investment strategies and assess valuation scenarios for Galmed Pharmaceuticals (GLMD).
- Market Analysts: Enhance your analysis with a ready-to-use, customizable financial model tailored for biotech firms.
- Entrepreneurs: Understand how large pharmaceutical companies like Galmed Pharmaceuticals (GLMD) are evaluated in the market.
What the Template Contains
- Historical Data: Includes Galmed Pharmaceuticals Ltd.’s (GLMD) past financials and baseline forecasts.
- DCF and Levered DCF Models: Detailed templates to calculate Galmed Pharmaceuticals Ltd.’s (GLMD) intrinsic value.
- WACC Sheet: Pre-built calculations for Weighted Average Cost of Capital.
- Editable Inputs: Modify key drivers like growth rates, EBITDA %, and CAPEX assumptions.
- Quarterly and Annual Statements: A complete breakdown of Galmed Pharmaceuticals Ltd.’s (GLMD) financials.
- Interactive Dashboard: Visualize valuation results and projections dynamically.
Disclaimer
All information, articles, and product details provided on this website are for general informational and educational purposes only. We do not claim any ownership over, nor do we intend to infringe upon, any trademarks, copyrights, logos, brand names, or other intellectual property mentioned or depicted on this site. Such intellectual property remains the property of its respective owners, and any references here are made solely for identification or informational purposes, without implying any affiliation, endorsement, or partnership.
We make no representations or warranties, express or implied, regarding the accuracy, completeness, or suitability of any content or products presented. Nothing on this website should be construed as legal, tax, investment, financial, medical, or other professional advice. In addition, no part of this site—including articles or product references—constitutes a solicitation, recommendation, endorsement, advertisement, or offer to buy or sell any securities, franchises, or other financial instruments, particularly in jurisdictions where such activity would be unlawful.
All content is of a general nature and may not address the specific circumstances of any individual or entity. It is not a substitute for professional advice or services. Any actions you take based on the information provided here are strictly at your own risk. You accept full responsibility for any decisions or outcomes arising from your use of this website and agree to release us from any liability in connection with your use of, or reliance upon, the content or products found herein.