
|
Monte Rosa Therapeutics, Inc. (Kleber) DCF -Bewertung |
Fully Editable: Tailor To Your Needs In Excel Or Sheets
Professional Design: Trusted, Industry-Standard Templates
Investor-Approved Valuation Models
MAC/PC Compatible, Fully Unlocked
No Expertise Is Needed; Easy To Follow
Monte Rosa Therapeutics, Inc. (GLUE) Bundle
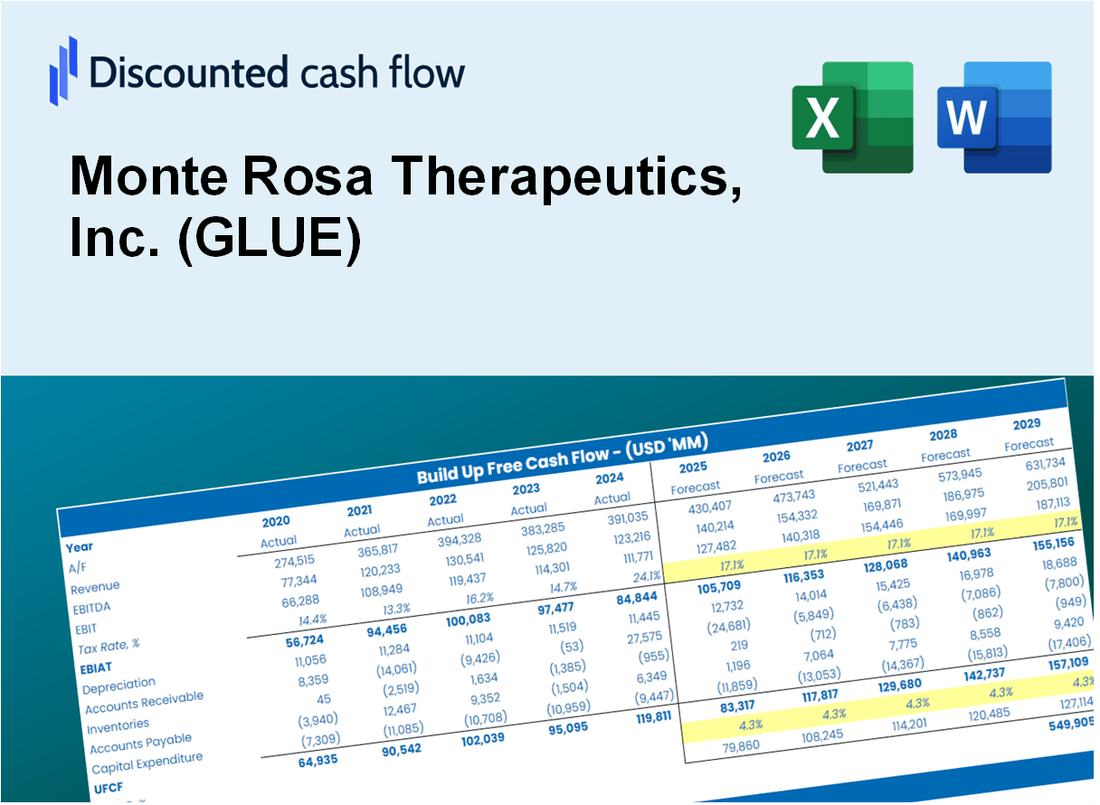
Verbessern Sie Ihre Anlagestrategien mit dem DCF -Taschenrechner von Monte Rosa Therapeutics, Inc. (Glue)! Erforschen Sie die tatsächlichen Finanzdaten für Monte Rosa, passen Sie Wachstumsprojektionen und -kosten an und beobachten Sie sofort, wie sich Modifikationen auf den inneren Wert von (Kleber) auswirken.
What You Will Get
- Real GLUE Financials: Access to historical and projected data for precise valuation.
- Customizable Inputs: Adjust WACC, tax rates, revenue growth, and capital expenditures as needed.
- Dynamic Calculations: Intrinsic value and NPV are computed automatically.
- Scenario Analysis: Evaluate various scenarios to assess Monte Rosa Therapeutics' future performance.
- User-Friendly Design: Designed for professionals while remaining approachable for newcomers.
Key Features
- Comprehensive Data Set: Monte Rosa’s historical financial statements and detailed projections.
- Customizable Parameters: Adjust WACC, tax rates, revenue growth, and EBITDA margins as needed.
- Real-Time Insights: Monitor Monte Rosa’s intrinsic value recalculating instantly.
- Intuitive Visualizations: Dashboard graphs illustrate valuation outcomes and essential metrics.
- Designed for Precision: A robust tool for analysts, investors, and finance professionals.
How It Works
- Step 1: Download the prebuilt Excel template with Monte Rosa Therapeutics’ data included.
- Step 2: Explore the pre-filled sheets and familiarize yourself with the key metrics.
- Step 3: Update forecasts and assumptions in the editable yellow cells (WACC, growth, margins).
- Step 4: Instantly view recalculated results, including Monte Rosa Therapeutics’ intrinsic value.
- Step 5: Make informed investment decisions or generate reports using the outputs.
Why Choose This Calculator for Monte Rosa Therapeutics, Inc. (GLUE)?
- User-Friendly Interface: Perfect for both newcomers and seasoned professionals.
- Customizable Inputs: Adjust parameters easily to suit your financial analysis needs.
- Real-Time Insights: Observe immediate updates to Monte Rosa's valuation as you tweak inputs.
- Preloaded Data: Comes equipped with Monte Rosa's latest financial information for swift evaluations.
- Preferred by Experts: A go-to tool for investors and analysts seeking to make knowledgeable choices.
Who Should Use Monte Rosa Therapeutics, Inc. (GLUE)?
- Investors: Make informed decisions with insights from a cutting-edge biotechnology company.
- Biotech Analysts: Enhance your analysis with comprehensive data on innovative therapeutic solutions.
- Healthcare Consultants: Quickly tailor information for client discussions or strategic reports.
- Life Sciences Enthusiasts: Expand your knowledge of drug development processes and market trends.
- Educators and Students: Utilize it as a valuable resource in biotechnology and pharmaceutical studies.
What the Template Contains
- Pre-Filled DCF Model: Monte Rosa Therapeutics’ financial data preloaded for immediate use.
- WACC Calculator: Detailed calculations for Weighted Average Cost of Capital.
- Financial Ratios: Evaluate Monte Rosa Therapeutics’ profitability, leverage, and efficiency.
- Editable Inputs: Change assumptions such as growth, margins, and CAPEX to fit your scenarios.
- Financial Statements: Annual and quarterly reports to support detailed analysis.
- Interactive Dashboard: Easily visualize key valuation metrics and results.
Disclaimer
All information, articles, and product details provided on this website are for general informational and educational purposes only. We do not claim any ownership over, nor do we intend to infringe upon, any trademarks, copyrights, logos, brand names, or other intellectual property mentioned or depicted on this site. Such intellectual property remains the property of its respective owners, and any references here are made solely for identification or informational purposes, without implying any affiliation, endorsement, or partnership.
We make no representations or warranties, express or implied, regarding the accuracy, completeness, or suitability of any content or products presented. Nothing on this website should be construed as legal, tax, investment, financial, medical, or other professional advice. In addition, no part of this site—including articles or product references—constitutes a solicitation, recommendation, endorsement, advertisement, or offer to buy or sell any securities, franchises, or other financial instruments, particularly in jurisdictions where such activity would be unlawful.
All content is of a general nature and may not address the specific circumstances of any individual or entity. It is not a substitute for professional advice or services. Any actions you take based on the information provided here are strictly at your own risk. You accept full responsibility for any decisions or outcomes arising from your use of this website and agree to release us from any liability in connection with your use of, or reliance upon, the content or products found herein.