
|
Esports Entertainment Group, Inc. (GMBL) DCF -Bewertung |
Fully Editable: Tailor To Your Needs In Excel Or Sheets
Professional Design: Trusted, Industry-Standard Templates
Investor-Approved Valuation Models
MAC/PC Compatible, Fully Unlocked
No Expertise Is Needed; Easy To Follow
Esports Entertainment Group, Inc. (GMBL) Bundle
Möchten Sie den inneren Wert der eSports Entertainment Group, Inc. bestimmen? Unser (GMBL) DCF-Taschenrechner integriert reale Daten mit umfangreichen Anpassungsoptionen, sodass Sie Ihre Prognosen verfeinern und fundiertere Investitionsentscheidungen treffen können.
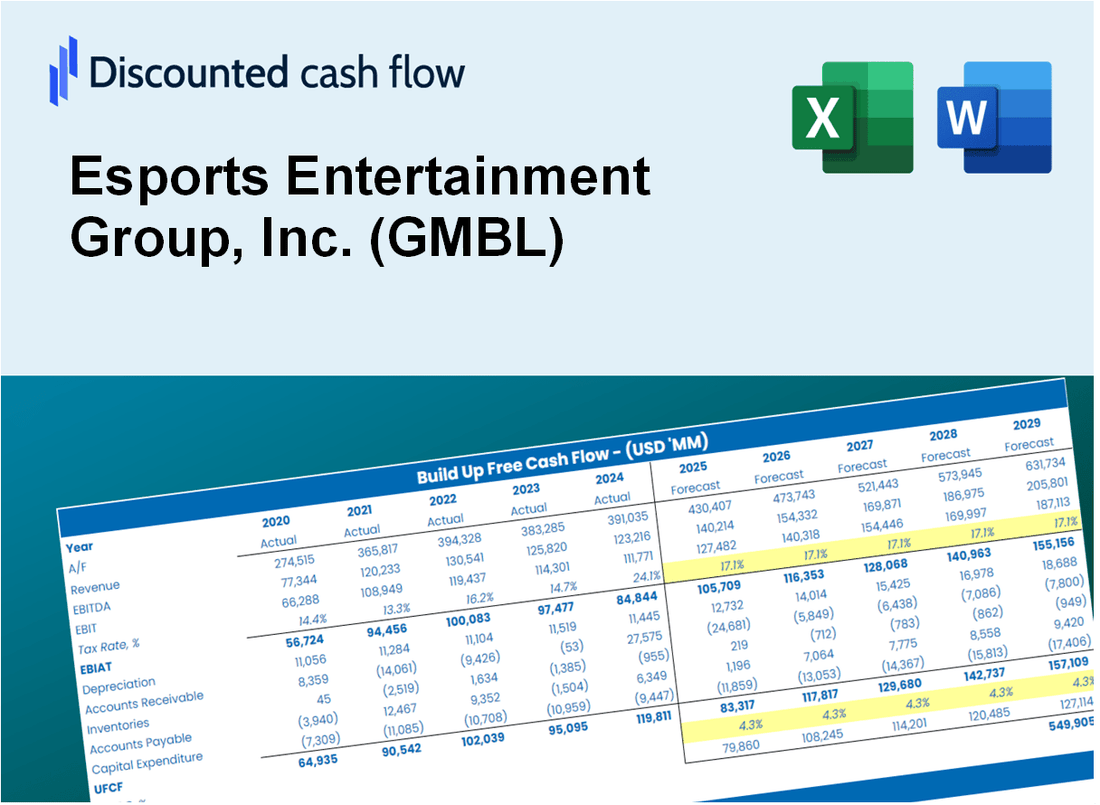
Discounted Cash Flow (DCF) - (USD MM)
| Year | AY1 2020 |
AY2 2021 |
AY3 2022 |
AY4 2023 |
AY5 2024 |
FY1 2025 |
FY2 2026 |
FY3 2027 |
FY4 2028 |
FY5 2029 |
|---|---|---|---|---|---|---|---|---|---|---|
| Revenue | .0 | 16.8 | 58.4 | 23.0 | 8.1 | 7.6 | 7.1 | 6.7 | 6.2 | 5.8 |
| Revenue Growth, % | 0 | 0 | 247.66 | -60.64 | -64.72 | -6.34 | -6.34 | -6.34 | -6.34 | -6.34 |
| EBITDA | -4.0 | -25.9 | -89.0 | -23.3 | -24.1 | -4.6 | -4.3 | -4.0 | -3.7 | -3.5 |
| EBITDA, % | 100 | -154.35 | -152.44 | -101.36 | -297.4 | -60 | -60 | -60 | -60 | -60 |
| Depreciation | .0 | 3.6 | 12.5 | 6.5 | 2.8 | 3.1 | 2.9 | 2.7 | 2.6 | 2.4 |
| Depreciation, % | 100 | 21.32 | 21.48 | 28.4 | 34.03 | 41.05 | 41.05 | 41.05 | 41.05 | 41.05 |
| EBIT | -4.0 | -29.5 | -101.5 | -29.8 | -26.9 | -4.6 | -4.3 | -4.0 | -3.7 | -3.5 |
| EBIT, % | 100 | -175.68 | -173.92 | -129.76 | -331.43 | -60 | -60 | -60 | -60 | -60 |
| Total Cash | 12.4 | 19.9 | 2.5 | 1.7 | .2 | 3.2 | 3.0 | 2.9 | 2.7 | 2.5 |
| Total Cash, percent | .0 | .0 | .0 | .0 | .0 | .0 | .0 | .0 | .0 | .0 |
| Account Receivables | .0 | 3.1 | 3.7 | 1.4 | .7 | 2.1 | 2.0 | 1.9 | 1.7 | 1.6 |
| Account Receivables, % | 100 | 18.38 | 6.39 | 6.2 | 8.14 | 27.82 | 27.82 | 27.82 | 27.82 | 27.82 |
| Inventories | .0 | .0 | 3.5 | .0 | .0 | 1.6 | 1.5 | 1.4 | 1.3 | 1.2 |
| Inventories, % | 100 | 0 | 6.01 | 0 | 0 | 21.2 | 21.2 | 21.2 | 21.2 | 21.2 |
| Accounts Payable | .5 | 2.6 | 5.1 | 4.5 | 4.6 | 3.0 | 2.8 | 2.7 | 2.5 | 2.3 |
| Accounts Payable, % | 100 | 15.55 | 8.69 | 19.46 | 56.29 | 40 | 40 | 40 | 40 | 40 |
| Capital Expenditure | .0 | -.1 | -.1 | .0 | .0 | .0 | .0 | .0 | .0 | .0 |
| Capital Expenditure, % | 100 | -0.3717 | -0.23603 | -0.01446063 | -0.000037027894 | -0.12445 | -0.12445 | -0.12445 | -0.12445 | -0.12445 |
| Tax Rate, % | 0 | 0 | 0 | 0 | 0 | 0 | 0 | 0 | 0 | 0 |
| EBITAT | -4.1 | -25.8 | -96.1 | -29.8 | -26.9 | -4.4 | -4.1 | -3.9 | -3.6 | -3.4 |
| Depreciation | ||||||||||
| Changes in Account Receivables | ||||||||||
| Changes in Inventories | ||||||||||
| Changes in Accounts Payable | ||||||||||
| Capital Expenditure | ||||||||||
| UFCF | -3.5 | -23.2 | -85.4 | -18.1 | -23.2 | -5.9 | -1.2 | -1.1 | -1.0 | -1.0 |
| WACC, % | 4.47 | 4.09 | 4.31 | 4.47 | 4.47 | 4.36 | 4.36 | 4.36 | 4.36 | 4.36 |
| PV UFCF | ||||||||||
| SUM PV UFCF | -9.3 | |||||||||
| Long Term Growth Rate, % | 2.00 | |||||||||
| Free cash flow (T + 1) | -1 | |||||||||
| Terminal Value | -41 | |||||||||
| Present Terminal Value | -33 | |||||||||
| Enterprise Value | -42 | |||||||||
| Net Debt | 1 | |||||||||
| Equity Value | -44 | |||||||||
| Diluted Shares Outstanding, MM | 1 | |||||||||
| Equity Value Per Share | -61.69 |
What You Will Get
- Real Esports Data: Preloaded financials – from revenue to EBIT – based on actual and projected figures for Esports Entertainment Group, Inc. (GMBL).
- Full Customization: Adjust all critical parameters (yellow cells) such as WACC, growth %, and tax rates to fit your analysis needs.
- Instant Valuation Updates: Automatic recalculations to evaluate the impact of changes on GMBL’s fair value.
- Versatile Excel Template: Designed for quick modifications, scenario testing, and comprehensive projections.
- Time-Saving and Accurate: Avoid building models from the ground up while ensuring precision and adaptability.
Key Features
- 🔍 Real-Life GMBL Financials: Pre-filled historical and projected data for Esports Entertainment Group, Inc. (GMBL).
- ✏️ Fully Customizable Inputs: Adjust all critical parameters (yellow cells) such as WACC, growth %, and tax rates.
- 📊 Professional DCF Valuation: Built-in formulas calculate Esports Entertainment Group’s intrinsic value using the Discounted Cash Flow method.
- ⚡ Instant Results: Visualize Esports Entertainment Group’s valuation instantly after making changes.
- Scenario Analysis: Test and compare outcomes for various financial assumptions side-by-side.
How It Works
- 1. Access the Template: Download and open the Excel file containing Esports Entertainment Group, Inc.'s (GMBL) preloaded data.
- 2. Adjust Key Inputs: Modify essential parameters such as growth projections, WACC, and capital expenditures.
- 3. Analyze Results Immediately: The DCF model automatically computes intrinsic value and NPV based on your inputs.
- 4. Explore Different Scenarios: Evaluate various forecasts to investigate a range of valuation possibilities.
- 5. Present with Assurance: Deliver expert valuation insights to back your strategic decisions.
Why Choose This Calculator for Esports Entertainment Group, Inc. (GMBL)?
- Accuracy: Up-to-date financial data ensures precise calculations.
- Flexibility: Users can easily adjust and test various input scenarios.
- Time-Saving: Eliminate the need to create a financial model from the ground up.
- Professional-Grade: Crafted with the expertise and standards expected at the CFO level.
- User-Friendly: Intuitive interface suitable for all users, regardless of financial modeling background.
Who Should Use This Product?
- Esports Enthusiasts: Stay updated on the latest trends and opportunities in the esports market.
- Investors: Make informed decisions about buying or selling Esports Entertainment Group, Inc. (GMBL) stock.
- Market Analysts: Utilize comprehensive data to analyze the growth potential of the esports industry.
- Gaming Professionals: Gain insights into how companies like Esports Entertainment Group, Inc. (GMBL) position themselves in the competitive landscape.
- Students of Business: Explore the dynamics of the esports sector through real-world case studies and financial analysis.
What the Template Contains
- Pre-Filled DCF Model: Esports Entertainment Group’s (GMBL) financial data preloaded for immediate use.
- WACC Calculator: Detailed calculations for Weighted Average Cost of Capital.
- Financial Ratios: Evaluate Esports Entertainment Group’s profitability, leverage, and efficiency.
- Editable Inputs: Change assumptions such as growth, margins, and CAPEX to fit your scenarios.
- Financial Statements: Annual and quarterly reports to support detailed analysis.
- Interactive Dashboard: Easily visualize key valuation metrics and results.
Disclaimer
All information, articles, and product details provided on this website are for general informational and educational purposes only. We do not claim any ownership over, nor do we intend to infringe upon, any trademarks, copyrights, logos, brand names, or other intellectual property mentioned or depicted on this site. Such intellectual property remains the property of its respective owners, and any references here are made solely for identification or informational purposes, without implying any affiliation, endorsement, or partnership.
We make no representations or warranties, express or implied, regarding the accuracy, completeness, or suitability of any content or products presented. Nothing on this website should be construed as legal, tax, investment, financial, medical, or other professional advice. In addition, no part of this site—including articles or product references—constitutes a solicitation, recommendation, endorsement, advertisement, or offer to buy or sell any securities, franchises, or other financial instruments, particularly in jurisdictions where such activity would be unlawful.
All content is of a general nature and may not address the specific circumstances of any individual or entity. It is not a substitute for professional advice or services. Any actions you take based on the information provided here are strictly at your own risk. You accept full responsibility for any decisions or outcomes arising from your use of this website and agree to release us from any liability in connection with your use of, or reliance upon, the content or products found herein.