
|
GMR Infrastructure Limited (GMRINFRA.NS) DCF -Bewertung |
Fully Editable: Tailor To Your Needs In Excel Or Sheets
Professional Design: Trusted, Industry-Standard Templates
Investor-Approved Valuation Models
MAC/PC Compatible, Fully Unlocked
No Expertise Is Needed; Easy To Follow
GMR Airports Infrastructure Limited (GMRINFRA.NS) Bundle
Bewerten Sie die finanziellen Aussichten von GMR Infrastructure Limited wie ein Experte! Dieser GMRINFRANS-DCF-Taschenrechner verfügt über vorgefüllte Finanzdaten und bietet Ihnen die Flexibilität, das Umsatzwachstum, die WACC, die Margen und andere wesentliche Annahmen zu ändern, um sich an Ihren Projektionen anzupassen.
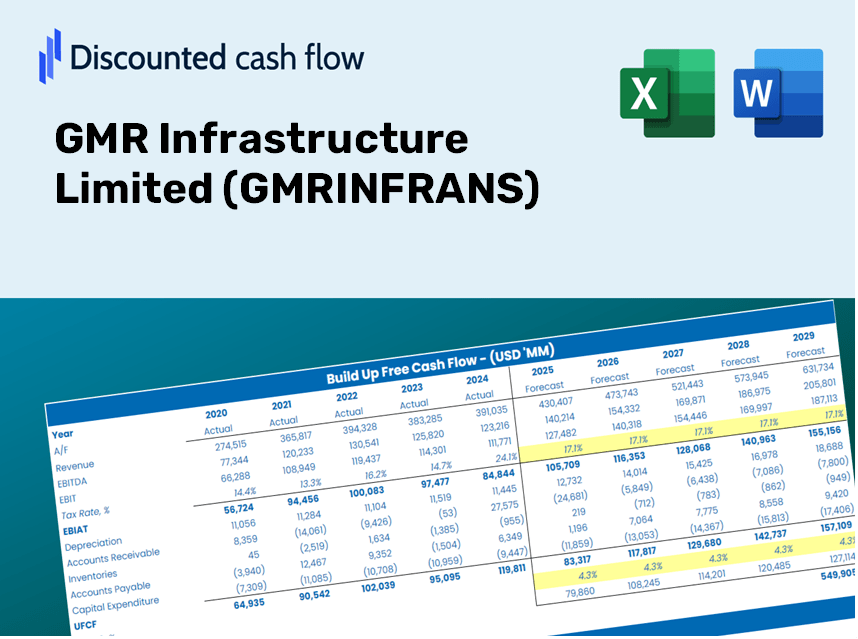
Discounted Cash Flow (DCF) - (USD MM)
| Year | AY1 2019 |
AY2 2020 |
AY3 2021 |
AY4 2022 |
AY5 2023 |
FY1 2024 |
FY2 2025 |
FY3 2026 |
FY4 2027 |
FY5 2028 |
|---|---|---|---|---|---|---|---|---|---|---|
| Revenue | 75,152.4 | 26,621.6 | 46,007.2 | 66,934.0 | 85,951.6 | 103,602.0 | 124,876.9 | 150,520.6 | 181,430.4 | 218,687.6 |
| Revenue Growth, % | 0 | -64.58 | 72.82 | 45.49 | 28.41 | 20.54 | 20.54 | 20.54 | 20.54 | 20.54 |
| EBITDA | 26,133.5 | 12,186.3 | 20,727.5 | 26,145.4 | 36,730.2 | 42,973.6 | 51,798.4 | 62,435.3 | 75,256.5 | 90,710.6 |
| EBITDA, % | 34.77 | 45.78 | 45.05 | 39.06 | 42.73 | 41.48 | 41.48 | 41.48 | 41.48 | 41.48 |
| Depreciation | 10,633.6 | 8,861.2 | 8,894.0 | 10,424.4 | 14,659.2 | 20,595.3 | 24,824.6 | 29,922.4 | 36,067.0 | 43,473.4 |
| Depreciation, % | 14.15 | 33.29 | 19.33 | 15.57 | 17.06 | 19.88 | 19.88 | 19.88 | 19.88 | 19.88 |
| EBIT | 15,499.9 | 3,325.1 | 11,833.5 | 15,721.0 | 22,071.0 | 22,378.3 | 26,973.8 | 32,512.9 | 39,189.5 | 47,237.2 |
| EBIT, % | 20.62 | 12.49 | 25.72 | 23.49 | 25.68 | 21.6 | 21.6 | 21.6 | 21.6 | 21.6 |
| Total Cash | 59,194.3 | 73,349.9 | 47,501.8 | 75,523.1 | 56,125.8 | 92,012.0 | 110,906.9 | 133,681.9 | 161,133.8 | 194,223.0 |
| Total Cash, percent | .0 | .0 | .0 | .0 | .0 | .0 | .0 | .0 | .0 | .0 |
| Account Receivables | 39,463.9 | 36,244.6 | -523.5 | 15,137.4 | 13,803.0 | 39,378.8 | 47,465.3 | 57,212.4 | 68,961.1 | 83,122.4 |
| Account Receivables, % | 52.51 | 136.15 | -1.14 | 22.62 | 16.06 | 38.01 | 38.01 | 38.01 | 38.01 | 38.01 |
| Inventories | 1,905.3 | 1,745.6 | 923.9 | 1,347.3 | 1,302.7 | 3,031.2 | 3,653.6 | 4,403.9 | 5,308.3 | 6,398.4 |
| Inventories, % | 2.54 | 6.56 | 2.01 | 2.01 | 1.52 | 2.93 | 2.93 | 2.93 | 2.93 | 2.93 |
| Accounts Payable | 20,716.3 | 24,595.8 | 20,573.0 | 25,556.7 | 10,853.1 | 44,648.7 | 53,817.4 | 64,869.0 | 78,190.0 | 94,246.4 |
| Accounts Payable, % | 27.57 | 92.39 | 44.72 | 38.18 | 12.63 | 43.1 | 43.1 | 43.1 | 43.1 | 43.1 |
| Capital Expenditure | -29,120.9 | -16,458.6 | -31,377.2 | -39,213.5 | -45,245.8 | -58,017.2 | -69,931.1 | -84,291.7 | -101,601.1 | -122,465.2 |
| Capital Expenditure, % | -38.75 | -61.82 | -68.2 | -58.59 | -52.64 | -56 | -56 | -56 | -56 | -56 |
| Tax Rate, % | 35.08 | 35.08 | 35.08 | 35.08 | 35.08 | 35.08 | 35.08 | 35.08 | 35.08 | 35.08 |
| EBITAT | 16,490.8 | 6,080.9 | 15,837.0 | 3,882.5 | 14,329.4 | 17,438.1 | 21,019.1 | 25,335.4 | 30,538.1 | 36,809.1 |
| Depreciation | ||||||||||
| Changes in Account Receivables | ||||||||||
| Changes in Inventories | ||||||||||
| Changes in Accounts Payable | ||||||||||
| Capital Expenditure | ||||||||||
| UFCF | -22,649.4 | 5,742.0 | 26,920.8 | -36,007.2 | -29,581.8 | -13,492.4 | -23,627.7 | -28,479.8 | -34,328.1 | -41,377.5 |
| WACC, % | 8.02 | 8.02 | 8.02 | 5.25 | 6.73 | 7.21 | 7.21 | 7.21 | 7.21 | 7.21 |
| PV UFCF | ||||||||||
| SUM PV UFCF | -111,454.4 | |||||||||
| Long Term Growth Rate, % | 2.00 | |||||||||
| Free cash flow (T + 1) | -42,205 | |||||||||
| Terminal Value | -810,221 | |||||||||
| Present Terminal Value | -572,065 | |||||||||
| Enterprise Value | -683,519 | |||||||||
| Net Debt | 340,917 | |||||||||
| Equity Value | -1,024,437 | |||||||||
| Diluted Shares Outstanding, MM | 6,014 | |||||||||
| Equity Value Per Share | -170.35 |
What You Will Gain
- Authentic GMR Data: Preloaded financial metrics – from revenue to EBIT – derived from both actual and projected figures for GMR Infrastructure Limited (GMRINFRANS).
- Complete Customization: Modify all key parameters (yellow cells) such as WACC, growth %, and tax rates to suit your needs.
- Instant Valuation Updates: Automatic recalculations that allow you to assess the effects of changes on GMR’s fair value.
- Flexible Excel Template: Designed for easy adjustments, scenario analysis, and comprehensive projections.
- Efficient and Precise: Avoid the hassle of creating models from scratch while ensuring accuracy and adaptability.
Key Features
- Accurate Financial Data: Gain access to reliable pre-loaded historical performance and future forecasts for GMR Infrastructure Limited (GMRINFRANS).
- Personalized Forecast Inputs: Modify editable yellow-highlighted fields such as WACC, growth rates, and profit margins.
- Automated Calculations: Real-time updates for DCF, Net Present Value (NPV), and cash flow analysis.
- User-Friendly Dashboard: Clear and concise charts and summaries to effectively visualize your valuation outcomes.
- Designed for All Levels: An intuitive interface tailored for investors, CFOs, and consultants, suitable for both experts and beginners.
How It Functions
- Download the Template: Gain immediate access to the Excel-based GMR Infrastructure Limited (GMRINFRANS) DCF Calculator.
- Input Your Assumptions: Modify the yellow-highlighted cells for growth projections, WACC, profit margins, and more.
- Instant Calculations: The model instantly recalculates the intrinsic value of GMR Infrastructure Limited (GMRINFRANS).
- Test Scenarios: Experiment with various assumptions to analyze potential changes in valuation.
- Analyze and Decide: Utilize the results to inform your investment decisions or financial assessments.
Why Choose This Calculator for GMR Infrastructure Limited (GMRINFRANS)?
- User-Friendly Interface: Perfectly crafted for both novice and seasoned users.
- Customizable Parameters: Easily adjust inputs to suit your financial analysis needs.
- Real-Time Results: Instantly observe changes to GMR Infrastructure's valuation as you modify your inputs.
- Preloaded Data: Equipped with GMR Infrastructure's actual financial information for swift evaluations.
- Industry Trusted: Utilized by investors and financial analysts for making well-informed decisions.
Who Should Use This Product?
- Individual Investors: Make informed choices regarding the purchase or sale of GMR Infrastructure Limited (GMRINFRANS) shares.
- Financial Analysts: Enhance valuation processes with readily available financial models specific to GMR Infrastructure Limited (GMRINFRANS).
- Consultants: Provide clients with expert valuation insights for GMR Infrastructure Limited (GMRINFRANS) efficiently and accurately.
- Business Owners: Gain insights into how large entities like GMR Infrastructure Limited (GMRINFRANS) are valued to inform your own business strategies.
- Finance Students: Master valuation methods using real-world examples and data, including GMR Infrastructure Limited (GMRINFRANS).
Contents of the GMR Infrastructure Limited Template
- In-depth DCF Model: An editable template featuring comprehensive valuation calculations.
- Historical and Projected Data: GMR Infrastructure Limited’s (GMRINFRANS) financials are preloaded for thorough analysis.
- Flexible Input Parameters: Modify WACC, growth rates, and tax assumptions to evaluate different scenarios.
- Complete Financial Statements: Detailed annual and quarterly breakdowns for enhanced insights.
- Essential Ratios: Integrated analysis for profitability, efficiency, and leverage metrics.
- Visual Dashboard: Charts and tables that provide clear, actionable insights.
Disclaimer
All information, articles, and product details provided on this website are for general informational and educational purposes only. We do not claim any ownership over, nor do we intend to infringe upon, any trademarks, copyrights, logos, brand names, or other intellectual property mentioned or depicted on this site. Such intellectual property remains the property of its respective owners, and any references here are made solely for identification or informational purposes, without implying any affiliation, endorsement, or partnership.
We make no representations or warranties, express or implied, regarding the accuracy, completeness, or suitability of any content or products presented. Nothing on this website should be construed as legal, tax, investment, financial, medical, or other professional advice. In addition, no part of this site—including articles or product references—constitutes a solicitation, recommendation, endorsement, advertisement, or offer to buy or sell any securities, franchises, or other financial instruments, particularly in jurisdictions where such activity would be unlawful.
All content is of a general nature and may not address the specific circumstances of any individual or entity. It is not a substitute for professional advice or services. Any actions you take based on the information provided here are strictly at your own risk. You accept full responsibility for any decisions or outcomes arising from your use of this website and agree to release us from any liability in connection with your use of, or reliance upon, the content or products found herein.