
|
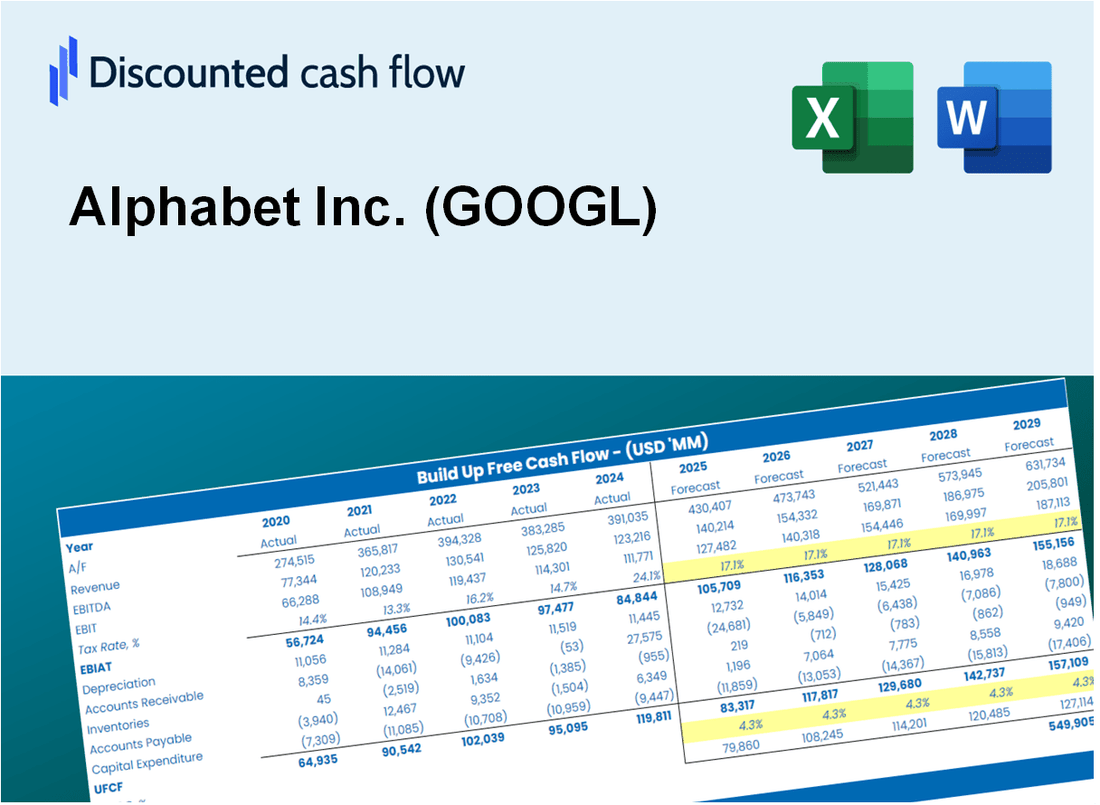
Alphabet Inc. (Googl) DCF -Bewertung |
Fully Editable: Tailor To Your Needs In Excel Or Sheets
Professional Design: Trusted, Industry-Standard Templates
Investor-Approved Valuation Models
MAC/PC Compatible, Fully Unlocked
No Expertise Is Needed; Easy To Follow
Alphabet Inc. (GOOGL) Bundle
Unser (dogl) DCF-Taschenrechner (dogl) ermöglicht es Ihnen, die Bewertung von Alphabet Inc. mithilfe realer Finanzdaten zu bewerten und vollständige Flexibilität zu bieten, um alle Schlüsselparameter für verbesserte Projektionen zu ändern.
What You Will Get
- Real Alphabet Data: Preloaded financials – from revenue to EBIT – based on actual and projected figures.
- Full Customization: Adjust all critical parameters (yellow cells) like WACC, growth %, and tax rates.
- Instant Valuation Updates: Automatic recalculations to analyze the impact of changes on Alphabet’s fair value.
- Versatile Excel Template: Tailored for quick edits, scenario testing, and detailed projections.
- Time-Saving and Accurate: Skip building models from scratch while maintaining precision and flexibility.
Key Features
- Comprehensive Alphabet Financials: Gain access to precise pre-loaded historical data and future forecasts.
- Tailorable Forecast Assumptions: Modify yellow-highlighted cells such as WACC, growth rates, and profit margins.
- Real-Time Calculations: Automatic updates for DCF, Net Present Value (NPV), and cash flow assessments.
- Interactive Dashboard: User-friendly charts and summaries to help visualize your valuation outcomes.
- Designed for All Users: An intuitive layout suitable for investors, CFOs, and consultants alike.
How It Works
- Step 1: Download the Excel file.
- Step 2: Review pre-entered Alphabet Inc. (GOOGL) data (historical and projected).
- Step 3: Adjust key assumptions (yellow cells) based on your analysis.
- Step 4: View automatic recalculations for Alphabet Inc. (GOOGL)’s intrinsic value.
- Step 5: Use the outputs for investment decisions or reporting.
Why Choose This Calculator for Alphabet Inc. (GOOGL)?
- Accurate Data: Utilize real Alphabet financials for dependable valuation insights.
- Customizable: Tailor essential parameters such as growth rates, WACC, and tax rates to align with your forecasts.
- Time-Saving: Built-in calculations save you from starting from the ground up.
- Professional-Grade Tool: Crafted for investors, analysts, and consultants in the industry.
- User-Friendly: Easy-to-navigate layout and clear instructions make it accessible for everyone.
Who Should Use Alphabet Inc. (GOOGL)?
- Investors: Make informed choices with insights from a leading technology company.
- Financial Analysts: Streamline your analysis with comprehensive data and metrics on Alphabet Inc. (GOOGL).
- Consultants: Easily tailor reports and presentations using Alphabet Inc. (GOOGL) data for your clients.
- Tech Enthusiasts: Enhance your knowledge of the tech industry's dynamics through Alphabet Inc. (GOOGL) case studies.
- Educators and Students: Utilize it as a real-world example in tech and finance-related educational programs.
What the Template Contains
- Operating and Balance Sheet Data: Pre-filled Alphabet Inc. (GOOGL) historical data and forecasts, including revenue, EBITDA, EBIT, and capital expenditures.
- WACC Calculation: A dedicated sheet for Weighted Average Cost of Capital (WACC), including parameters like Beta, risk-free rate, and share price.
- DCF Valuation (Unlevered and Levered): Editable Discounted Cash Flow models showing intrinsic value with detailed calculations.
- Financial Statements: Pre-loaded financial statements (annual and quarterly) to support analysis.
- Key Ratios: Includes profitability, leverage, and efficiency ratios for Alphabet Inc. (GOOGL).
- Dashboard and Charts: Visual summary of valuation outputs and assumptions to analyze results easily.
Disclaimer
All information, articles, and product details provided on this website are for general informational and educational purposes only. We do not claim any ownership over, nor do we intend to infringe upon, any trademarks, copyrights, logos, brand names, or other intellectual property mentioned or depicted on this site. Such intellectual property remains the property of its respective owners, and any references here are made solely for identification or informational purposes, without implying any affiliation, endorsement, or partnership.
We make no representations or warranties, express or implied, regarding the accuracy, completeness, or suitability of any content or products presented. Nothing on this website should be construed as legal, tax, investment, financial, medical, or other professional advice. In addition, no part of this site—including articles or product references—constitutes a solicitation, recommendation, endorsement, advertisement, or offer to buy or sell any securities, franchises, or other financial instruments, particularly in jurisdictions where such activity would be unlawful.
All content is of a general nature and may not address the specific circumstances of any individual or entity. It is not a substitute for professional advice or services. Any actions you take based on the information provided here are strictly at your own risk. You accept full responsibility for any decisions or outcomes arising from your use of this website and agree to release us from any liability in connection with your use of, or reliance upon, the content or products found herein.