
|
Green Plains Inc. (GPRE) DCF -Bewertung |
Fully Editable: Tailor To Your Needs In Excel Or Sheets
Professional Design: Trusted, Industry-Standard Templates
Investor-Approved Valuation Models
MAC/PC Compatible, Fully Unlocked
No Expertise Is Needed; Easy To Follow
Green Plains Inc. (GPRE) Bundle
Evaluieren Sie Green Plains Inc. (GPRE) Finanzaussichten mit Expertener Insight! Dieser (GPRE) DCF-Rechner bietet vorgefüllte Finanzdaten und vollständige Vielseitigkeit, um das Umsatzwachstum, WACC, Margen und andere wesentliche Annahmen zu ändern, um sich mit Ihren Vorhersagen auszurichten.
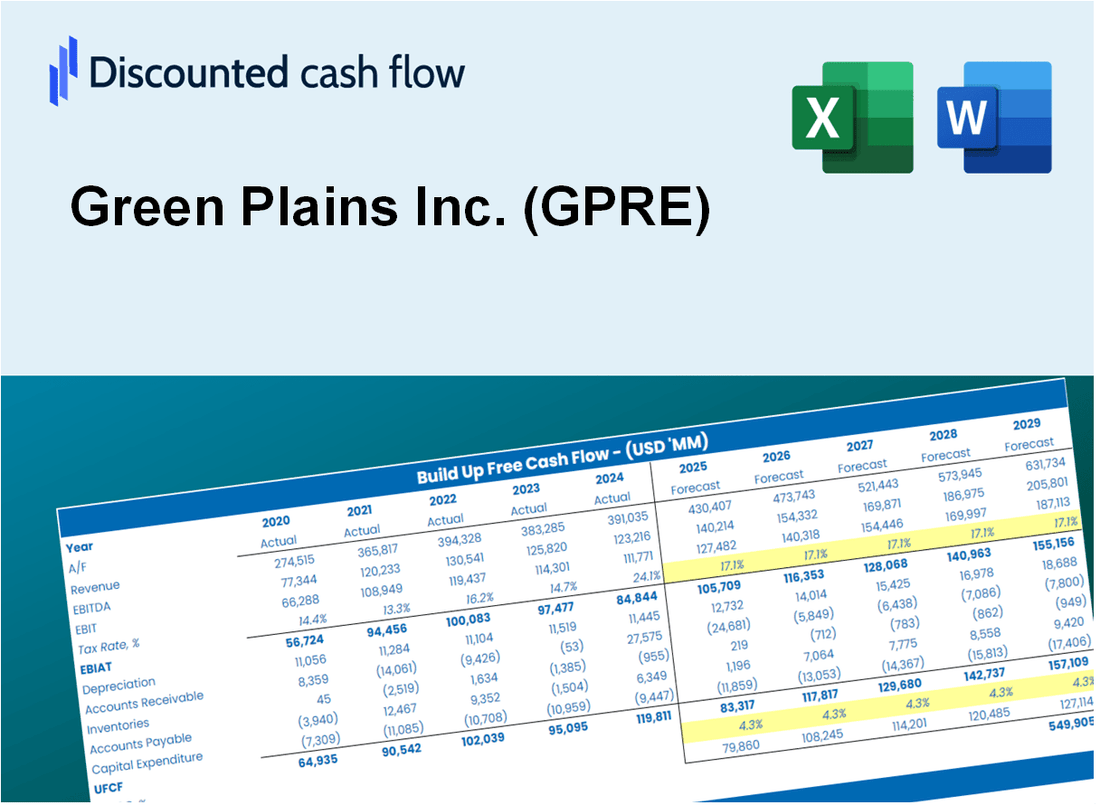
Discounted Cash Flow (DCF) - (USD MM)
| Year | AY1 2020 |
AY2 2021 |
AY3 2022 |
AY4 2023 |
AY5 2024 |
FY1 2025 |
FY2 2026 |
FY3 2027 |
FY4 2028 |
FY5 2029 |
|---|---|---|---|---|---|---|---|---|---|---|
| Revenue | 1,923.7 | 2,827.2 | 3,662.8 | 3,295.7 | 2,458.8 | 2,711.5 | 2,990.1 | 3,297.4 | 3,636.2 | 4,009.9 |
| Revenue Growth, % | 0 | 46.96 | 29.56 | -10.02 | -25.39 | 10.28 | 10.28 | 10.28 | 10.28 | 10.28 |
| EBITDA | -42.9 | 116.1 | 26.2 | 53.6 | 50.6 | 34.0 | 37.5 | 41.4 | 45.7 | 50.3 |
| EBITDA, % | -2.23 | 4.11 | 0.71584 | 1.63 | 2.06 | 1.26 | 1.26 | 1.26 | 1.26 | 1.26 |
| Depreciation | 78.2 | 92.0 | 92.7 | 98.2 | 90.6 | 89.6 | 98.8 | 108.9 | 120.1 | 132.5 |
| Depreciation, % | 4.07 | 3.25 | 2.53 | 2.98 | 3.68 | 3.3 | 3.3 | 3.3 | 3.3 | 3.3 |
| EBIT | -121.1 | 24.1 | -66.5 | -44.6 | -40.0 | -55.5 | -61.2 | -67.5 | -74.5 | -82.1 |
| EBIT, % | -6.3 | 0.85396 | -1.81 | -1.35 | -1.63 | -2.05 | -2.05 | -2.05 | -2.05 | -2.05 |
| Total Cash | 233.9 | 551.1 | 444.7 | 349.6 | 173.0 | 333.1 | 367.4 | 405.1 | 446.8 | 492.7 |
| Total Cash, percent | .0 | .0 | .0 | .0 | .0 | .0 | .0 | .0 | .0 | .0 |
| Account Receivables | 56.2 | 120.9 | 109.9 | 95.3 | 94.9 | 91.9 | 101.4 | 111.8 | 123.3 | 135.9 |
| Account Receivables, % | 2.92 | 4.28 | 3 | 2.89 | 3.86 | 3.39 | 3.39 | 3.39 | 3.39 | 3.39 |
| Inventories | 269.5 | 267.8 | 279.0 | 215.8 | 227.4 | 254.3 | 280.5 | 309.3 | 341.1 | 376.1 |
| Inventories, % | 14.01 | 9.47 | 7.62 | 6.55 | 9.25 | 9.38 | 9.38 | 9.38 | 9.38 | 9.38 |
| Accounts Payable | 140.1 | 146.1 | 234.3 | 186.6 | 154.8 | 167.0 | 184.2 | 203.1 | 224.0 | 247.0 |
| Accounts Payable, % | 7.28 | 5.17 | 6.4 | 5.66 | 6.3 | 6.16 | 6.16 | 6.16 | 6.16 | 6.16 |
| Capital Expenditure | -110.6 | -187.2 | -212.4 | -108.1 | -95.1 | -137.3 | -151.4 | -166.9 | -184.1 | -203.0 |
| Capital Expenditure, % | -5.75 | -6.62 | -5.8 | -3.28 | -3.87 | -5.06 | -5.06 | -5.06 | -5.06 | -5.06 |
| Tax Rate, % | -10.03 | -10.03 | -10.03 | -10.03 | -10.03 | -10.03 | -10.03 | -10.03 | -10.03 | -10.03 |
| EBITAT | -94.1 | 37.7 | -85.7 | -50.9 | -44.0 | -53.0 | -58.5 | -64.5 | -71.1 | -78.4 |
| Depreciation | ||||||||||
| Changes in Account Receivables | ||||||||||
| Changes in Inventories | ||||||||||
| Changes in Accounts Payable | ||||||||||
| Capital Expenditure | ||||||||||
| UFCF | -312.1 | -114.6 | -117.3 | -30.6 | -91.6 | -112.4 | -129.5 | -142.8 | -157.5 | -173.7 |
| WACC, % | 6.83 | 7.4 | 7.4 | 7.4 | 7.4 | 7.29 | 7.29 | 7.29 | 7.29 | 7.29 |
| PV UFCF | ||||||||||
| SUM PV UFCF | -574.0 | |||||||||
| Long Term Growth Rate, % | 2.00 | |||||||||
| Free cash flow (T + 1) | -177 | |||||||||
| Terminal Value | -3,351 | |||||||||
| Present Terminal Value | -2,357 | |||||||||
| Enterprise Value | -2,931 | |||||||||
| Net Debt | 476 | |||||||||
| Equity Value | -3,408 | |||||||||
| Diluted Shares Outstanding, MM | 64 | |||||||||
| Equity Value Per Share | -53.42 |
What You Will Get
- Real GPRE Financial Data: Pre-filled with Green Plains Inc.’s historical and projected data for precise analysis.
- Fully Editable Template: Modify key inputs like revenue growth, WACC, and EBITDA % with ease.
- Automatic Calculations: See Green Plains Inc.’s intrinsic value update instantly based on your changes.
- Professional Valuation Tool: Designed for investors, analysts, and consultants seeking accurate DCF results.
- User-Friendly Design: Simple structure and clear instructions for all experience levels.
Key Features
- 🔍 Real-Life GPRE Financials: Pre-filled historical and projected data for Green Plains Inc. (GPRE).
- ✏️ Fully Customizable Inputs: Adjust all critical parameters (yellow cells) like WACC, growth %, and tax rates.
- 📊 Professional DCF Valuation: Built-in formulas calculate Green Plains’ intrinsic value using the Discounted Cash Flow method.
- ⚡ Instant Results: Visualize Green Plains’ valuation instantly after making changes.
- Scenario Analysis: Test and compare outcomes for various financial assumptions side-by-side.
How It Works
- Download the Template: Gain immediate access to the Excel-based GPRE DCF Calculator.
- Input Your Assumptions: Modify the yellow-highlighted cells for growth rates, WACC, margins, and other factors.
- Instant Calculations: The model automatically recalculates Green Plains Inc.'s intrinsic value.
- Test Scenarios: Experiment with different assumptions to assess potential valuation fluctuations.
- Analyze and Decide: Utilize the outcomes to inform your investment or financial analysis.
Why Choose Green Plains Inc. (GPRE)?
- Innovative Solutions: Leverage cutting-edge technology for sustainable agriculture.
- Environmental Commitment: Focused on reducing carbon footprint and promoting renewable energy.
- Expertise in Biofuels: Over a decade of experience in the biofuel industry enhances reliability.
- Strong Financial Performance: Proven track record of growth and profitability in a competitive market.
- Community Engagement: Actively involved in local initiatives and partnerships to support sustainable practices.
Who Should Use This Product?
- Environmental Science Students: Explore sustainable practices and analyze data related to renewable energy.
- Researchers: Integrate advanced models into studies focused on biofuels and agriculture.
- Investors: Evaluate your investment strategies and assess valuation metrics for Green Plains Inc. (GPRE).
- Financial Analysts: Enhance your analysis with a customizable financial model tailored for the renewable energy sector.
- Entrepreneurs: Understand how major players like Green Plains Inc. (GPRE) navigate the market and drive sustainability.
What the Template Contains
- Pre-Filled DCF Model: Green Plains Inc.’s (GPRE) financial data preloaded for immediate use.
- WACC Calculator: Detailed calculations for Weighted Average Cost of Capital.
- Financial Ratios: Evaluate Green Plains Inc.’s (GPRE) profitability, leverage, and efficiency.
- Editable Inputs: Change assumptions such as growth, margins, and CAPEX to fit your scenarios.
- Financial Statements: Annual and quarterly reports to support detailed analysis.
- Interactive Dashboard: Easily visualize key valuation metrics and results.
Disclaimer
All information, articles, and product details provided on this website are for general informational and educational purposes only. We do not claim any ownership over, nor do we intend to infringe upon, any trademarks, copyrights, logos, brand names, or other intellectual property mentioned or depicted on this site. Such intellectual property remains the property of its respective owners, and any references here are made solely for identification or informational purposes, without implying any affiliation, endorsement, or partnership.
We make no representations or warranties, express or implied, regarding the accuracy, completeness, or suitability of any content or products presented. Nothing on this website should be construed as legal, tax, investment, financial, medical, or other professional advice. In addition, no part of this site—including articles or product references—constitutes a solicitation, recommendation, endorsement, advertisement, or offer to buy or sell any securities, franchises, or other financial instruments, particularly in jurisdictions where such activity would be unlawful.
All content is of a general nature and may not address the specific circumstances of any individual or entity. It is not a substitute for professional advice or services. Any actions you take based on the information provided here are strictly at your own risk. You accept full responsibility for any decisions or outcomes arising from your use of this website and agree to release us from any liability in connection with your use of, or reliance upon, the content or products found herein.