
|
Gujarat State Dünger & Chemicals Limited (GSFC.NS) DCF -Bewertung |
Fully Editable: Tailor To Your Needs In Excel Or Sheets
Professional Design: Trusted, Industry-Standard Templates
Investor-Approved Valuation Models
MAC/PC Compatible, Fully Unlocked
No Expertise Is Needed; Easy To Follow
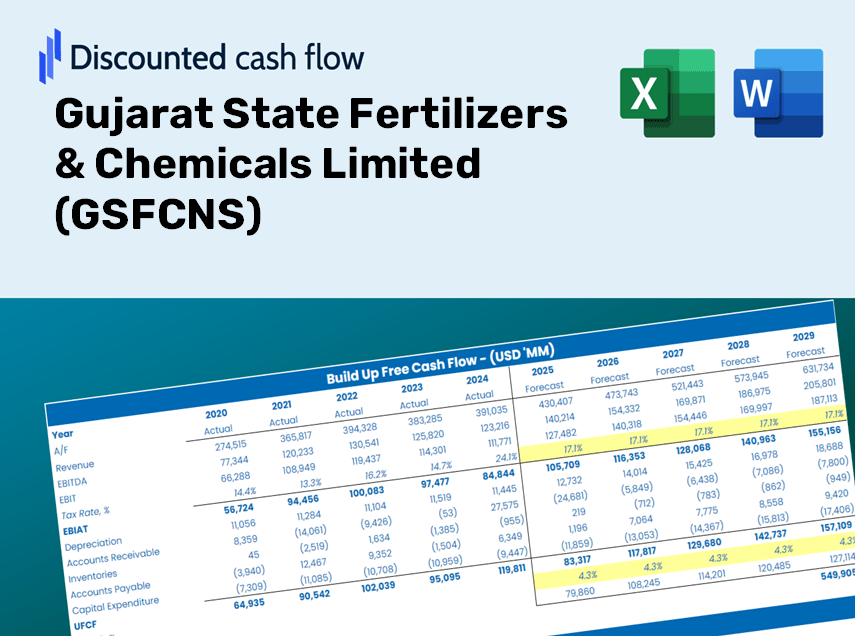
Gujarat State Fertilizers & Chemicals Limited (GSFC.NS) Bundle
Unser (GSFCNS) DCF -Taschenrechner für Genauigkeit entwickelt & Chemicals begrenzt mit tatsächlichen Finanzdaten und bietet vollständige Flexibilität, um alle wesentlichen Parameter für erweiterte Projektionen zu ändern.
Discounted Cash Flow (DCF) - (USD MM)
| Year | AY1 2021 |
AY2 2022 |
AY3 2023 |
AY4 2024 |
AY5 2025 |
FY1 2026 |
FY2 2027 |
FY3 2028 |
FY4 2029 |
FY5 2030 |
|---|---|---|---|---|---|---|---|---|---|---|
| Revenue | 76,340.6 | 90,847.9 | 55,449.5 | 56,141.6 | 95,339.6 | 96,421.4 | 97,515.5 | 98,622.0 | 99,741.0 | 100,872.8 |
| Revenue Growth, % | 0 | 19 | -38.96 | 1.25 | 69.82 | 1.13 | 1.13 | 1.13 | 1.13 | 1.13 |
| EBITDA | 7,574.3 | 15,051.5 | 17,397.0 | 8,930.3 | 9,465.9 | 16,140.8 | 16,324.0 | 16,509.2 | 16,696.5 | 16,886.0 |
| EBITDA, % | 9.92 | 16.57 | 31.37 | 15.91 | 9.93 | 16.74 | 16.74 | 16.74 | 16.74 | 16.74 |
| Depreciation | 1,801.4 | 1,817.7 | 1,849.9 | 1,864.5 | 1,920.2 | 2,513.1 | 2,541.6 | 2,570.5 | 2,599.6 | 2,629.1 |
| Depreciation, % | 2.36 | 2 | 3.34 | 3.32 | 2.01 | 2.61 | 2.61 | 2.61 | 2.61 | 2.61 |
| EBIT | 5,772.8 | 13,233.8 | 15,547.1 | 7,065.8 | 7,545.7 | 13,627.7 | 13,782.3 | 13,938.7 | 14,096.9 | 14,256.8 |
| EBIT, % | 7.56 | 14.57 | 28.04 | 12.59 | 7.91 | 14.13 | 14.13 | 14.13 | 14.13 | 14.13 |
| Total Cash | 11,116.1 | 16,506.9 | 14,327.7 | 22,995.7 | 19,871.2 | 23,213.1 | 23,476.5 | 23,742.8 | 24,012.2 | 24,284.7 |
| Total Cash, percent | .0 | .0 | .0 | .0 | .0 | .0 | .0 | .0 | .0 | .0 |
| Account Receivables | 7,227.9 | 12,966.2 | 24,178.4 | 19,215.7 | 19,076.4 | 23,446.0 | 23,712.0 | 23,981.1 | 24,253.2 | 24,528.4 |
| Account Receivables, % | 9.47 | 14.27 | 43.6 | 34.23 | 20.01 | 24.32 | 24.32 | 24.32 | 24.32 | 24.32 |
| Inventories | 9,965.7 | 13,915.4 | 13,237.1 | 13,047.6 | 14,792.8 | 17,548.8 | 17,747.9 | 17,949.3 | 18,152.9 | 18,358.9 |
| Inventories, % | 13.05 | 15.32 | 23.87 | 23.24 | 15.52 | 18.2 | 18.2 | 18.2 | 18.2 | 18.2 |
| Accounts Payable | 5,292.2 | 8,019.4 | 6,390.4 | 7,985.2 | 6,750.9 | 9,370.0 | 9,476.3 | 9,583.8 | 9,692.6 | 9,802.6 |
| Accounts Payable, % | 6.93 | 8.83 | 11.52 | 14.22 | 7.08 | 9.72 | 9.72 | 9.72 | 9.72 | 9.72 |
| Capital Expenditure | -884.1 | -948.2 | -1,420.3 | -2,402.0 | -3,795.4 | -2,511.3 | -2,539.8 | -2,568.6 | -2,597.8 | -2,627.3 |
| Capital Expenditure, % | -1.16 | -1.04 | -2.56 | -4.28 | -3.98 | -2.6 | -2.6 | -2.6 | -2.6 | -2.6 |
| Tax Rate, % | 21.85 | 21.85 | 21.85 | 21.85 | 21.85 | 21.85 | 21.85 | 21.85 | 21.85 | 21.85 |
| EBITAT | 4,857.6 | 9,041.9 | 12,757.6 | 5,662.8 | 5,897.3 | 10,706.7 | 10,828.1 | 10,951.0 | 11,075.3 | 11,200.9 |
| Depreciation | ||||||||||
| Changes in Account Receivables | ||||||||||
| Changes in Inventories | ||||||||||
| Changes in Accounts Payable | ||||||||||
| Capital Expenditure | ||||||||||
| UFCF | -6,126.4 | 2,950.5 | 1,024.4 | 11,872.3 | 1,181.9 | 6,202.0 | 10,471.1 | 10,589.9 | 10,710.1 | 10,831.6 |
| WACC, % | 4.79 | 4.77 | 4.79 | 4.79 | 4.78 | 4.78 | 4.78 | 4.78 | 4.78 | 4.78 |
| PV UFCF | ||||||||||
| SUM PV UFCF | 42,118.9 | |||||||||
| Long Term Growth Rate, % | 2.00 | |||||||||
| Free cash flow (T + 1) | 11,048 | |||||||||
| Terminal Value | 396,828 | |||||||||
| Present Terminal Value | 314,141 | |||||||||
| Enterprise Value | 356,260 | |||||||||
| Net Debt | -2,837 | |||||||||
| Equity Value | 359,097 | |||||||||
| Diluted Shares Outstanding, MM | 398 | |||||||||
| Equity Value Per Share | 901.43 |
Benefits of Choosing GSFCNS
- Real GSFC Financials: Access both historical and projected data for precise valuation.
- Customizable Inputs: Adjust parameters such as WACC, tax rates, revenue growth, and capital expenditures easily.
- Dynamic Calculations: Intrinsic value and NPV are automatically computed in real-time.
- Scenario Analysis: Explore various scenarios to assess GSFC's future potential.
- User-Friendly Design: Tailored for industry professionals while remaining approachable for newcomers.
Key Features
- Customizable Input Parameters: Adjust vital metrics such as revenue growth, EBITDA margin, and capital investments.
- Instant DCF Valuation: Quickly determines intrinsic value, NPV, and additional financial metrics.
- High Precision Results: Leverages Gujarat State Fertilizers & Chemicals Limited’s real financial data for credible valuation results.
- Streamlined Scenario Analysis: Effortlessly explore various assumptions and assess the results side-by-side.
- Efficiency Booster: Remove the complexity of constructing detailed valuation models from the ground up.
How It Works
- Step 1: Download the Excel file.
- Step 2: Review the pre-filled data for Gujarat State Fertilizers & Chemicals Limited (GSFCNS) including historical and projected figures.
- Step 3: Modify key assumptions (yellow cells) according to your own analysis.
- Step 4: Observe the automatic recalculations for the intrinsic value of Gujarat State Fertilizers & Chemicals Limited (GSFCNS).
- Step 5: Utilize the results for your investment decisions or reporting needs.
Why Choose the GSFC Calculator?
- Reliable Information: Accurate Gujarat State Fertilizers & Chemicals Limited (GSFCNS) financial data guarantees trustworthy valuation outcomes.
- Flexible Options: Tailor essential variables such as growth rates, WACC, and tax rates to align with your forecasts.
- Efficiency Boost: Pre-configured calculations save you the hassle of building from the ground up.
- Expert-Quality Tool: Crafted for investors, analysts, and consultants seeking professional insights.
- Easy to Use: Simple design and guided instructions allow for seamless navigation for all users.
Who Can Benefit from This Product?
- Agriculture Students: Discover key valuation methods and apply them with actual market data.
- Researchers: Integrate industry-standard models into your academic studies or projects.
- Investors: Validate your investment hypotheses and evaluate valuation metrics for GSFCNS (GSFC).
- Market Analysts: Optimize your analysis process with a tailored DCF model ready for use.
- Entrepreneurs: Understand the analytical approaches used for evaluating large firms like Gujarat State Fertilizers & Chemicals Limited.
Contents of the Template
- Comprehensive DCF Model: An editable template featuring detailed valuation calculations.
- Real-World Data: GSFCNS’s historical and projected financial data preloaded for in-depth analysis.
- Customizable Parameters: Modify WACC, growth rates, and tax assumptions to explore various scenarios.
- Financial Statements: Complete annual and quarterly breakdowns for enhanced insights.
- Key Ratios: Integrated analysis covering profitability, efficiency, and leverage metrics.
- Dashboard with Visual Outputs: Visuals and tables that present clear, actionable results.
Disclaimer
All information, articles, and product details provided on this website are for general informational and educational purposes only. We do not claim any ownership over, nor do we intend to infringe upon, any trademarks, copyrights, logos, brand names, or other intellectual property mentioned or depicted on this site. Such intellectual property remains the property of its respective owners, and any references here are made solely for identification or informational purposes, without implying any affiliation, endorsement, or partnership.
We make no representations or warranties, express or implied, regarding the accuracy, completeness, or suitability of any content or products presented. Nothing on this website should be construed as legal, tax, investment, financial, medical, or other professional advice. In addition, no part of this site—including articles or product references—constitutes a solicitation, recommendation, endorsement, advertisement, or offer to buy or sell any securities, franchises, or other financial instruments, particularly in jurisdictions where such activity would be unlawful.
All content is of a general nature and may not address the specific circumstances of any individual or entity. It is not a substitute for professional advice or services. Any actions you take based on the information provided here are strictly at your own risk. You accept full responsibility for any decisions or outcomes arising from your use of this website and agree to release us from any liability in connection with your use of, or reliance upon, the content or products found herein.