
|
Diagramm Industries, Inc. (GTLS) DCF -Bewertung |
Fully Editable: Tailor To Your Needs In Excel Or Sheets
Professional Design: Trusted, Industry-Standard Templates
Investor-Approved Valuation Models
MAC/PC Compatible, Fully Unlocked
No Expertise Is Needed; Easy To Follow
Chart Industries, Inc. (GTLS) Bundle
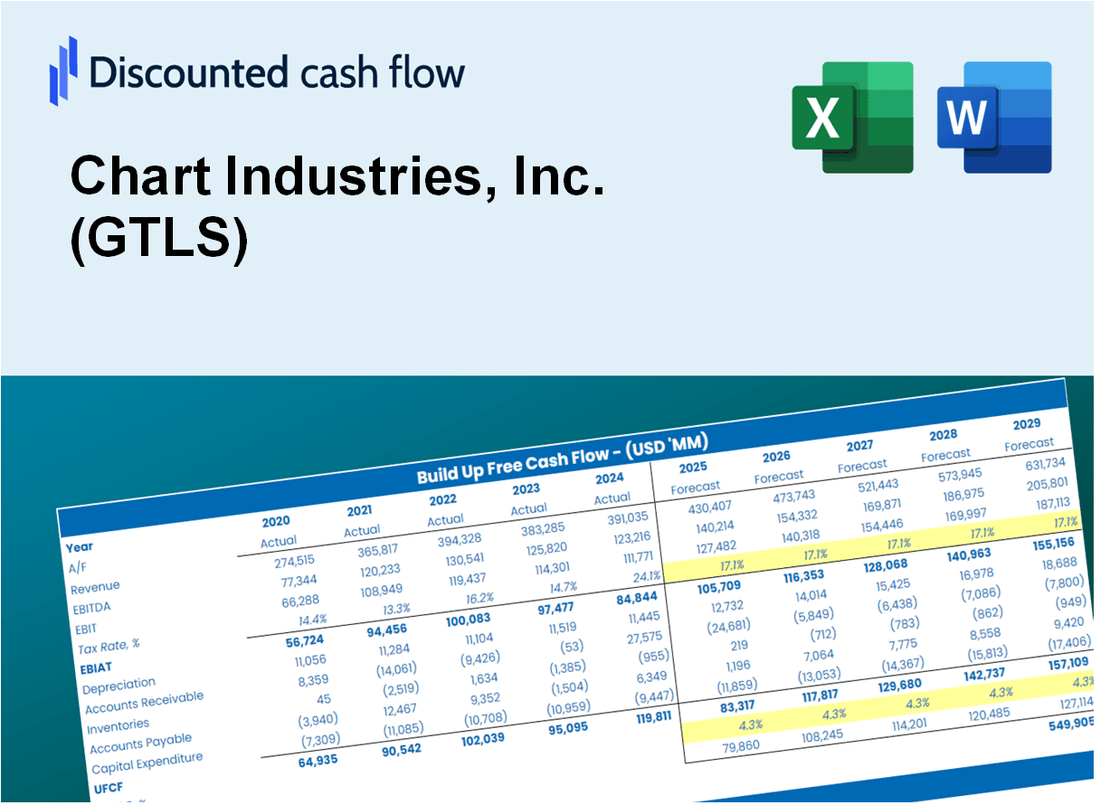
Vereinfachen Sie die Bewertung von Chart Industries, Inc. (GTLS) mit diesem anpassbaren DCF -Taschenrechner! Mit Real Chart Industries, Inc. (GTLS) Finanzdaten und einstellbaren Prognoseeingaben können Sie Szenarien testen und Chart Industries, Inc. (GTLS) in Minuten aufdecken.
Discounted Cash Flow (DCF) - (USD MM)
| Year | AY1 2020 |
AY2 2021 |
AY3 2022 |
AY4 2023 |
AY5 2024 |
FY1 2025 |
FY2 2026 |
FY3 2027 |
FY4 2028 |
FY5 2029 |
|---|---|---|---|---|---|---|---|---|---|---|
| Revenue | 1,177.1 | 1,317.7 | 1,612.4 | 3,352.5 | 4,160.3 | 5,807.8 | 8,107.8 | 11,318.6 | 15,800.9 | 22,058.2 |
| Revenue Growth, % | 0 | 11.94 | 22.36 | 107.92 | 24.1 | 39.6 | 39.6 | 39.6 | 39.6 | 39.6 |
| EBITDA | 188.1 | 165.4 | 212.5 | 578.2 | 916.9 | 940.8 | 1,313.4 | 1,833.6 | 2,559.7 | 3,573.3 |
| EBITDA, % | 15.98 | 12.55 | 13.18 | 17.25 | 22.04 | 16.2 | 16.2 | 16.2 | 16.2 | 16.2 |
| Depreciation | 85.2 | 80.6 | 81.9 | 231.1 | 269.9 | 369.6 | 515.9 | 720.2 | 1,005.4 | 1,403.6 |
| Depreciation, % | 7.24 | 6.12 | 5.08 | 6.89 | 6.49 | 6.36 | 6.36 | 6.36 | 6.36 | 6.36 |
| EBIT | 102.9 | 84.8 | 130.6 | 347.1 | 647.0 | 571.3 | 797.5 | 1,113.3 | 1,554.2 | 2,169.7 |
| EBIT, % | 8.74 | 6.44 | 8.1 | 10.35 | 15.55 | 9.84 | 9.84 | 9.84 | 9.84 | 9.84 |
| Total Cash | 125.1 | 122.2 | 663.6 | 188.3 | 308.6 | 860.6 | 1,201.4 | 1,677.2 | 2,341.4 | 3,268.7 |
| Total Cash, percent | .0 | .0 | .0 | .0 | .0 | .0 | .0 | .0 | .0 | .0 |
| Account Receivables | 280.2 | 329.8 | 646.5 | 1,240.6 | 1,487.4 | 1,878.1 | 2,621.8 | 3,660.1 | 5,109.6 | 7,133.0 |
| Account Receivables, % | 23.8 | 25.03 | 40.1 | 37.01 | 35.75 | 32.34 | 32.34 | 32.34 | 32.34 | 32.34 |
| Inventories | 248.4 | 321.5 | 357.9 | 576.3 | 490.5 | 1,123.0 | 1,567.7 | 2,188.5 | 3,055.2 | 4,265.1 |
| Inventories, % | 21.1 | 24.4 | 22.2 | 17.19 | 11.79 | 19.34 | 19.34 | 19.34 | 19.34 | 19.34 |
| Accounts Payable | 140.1 | 175.9 | 211.1 | 811.0 | 1,058.9 | 1,022.0 | 1,426.8 | 1,991.8 | 2,780.5 | 3,881.7 |
| Accounts Payable, % | 11.9 | 13.35 | 13.09 | 24.19 | 25.45 | 17.6 | 17.6 | 17.6 | 17.6 | 17.6 |
| Capital Expenditure | -37.9 | -52.7 | -74.2 | -135.6 | -120.8 | -218.0 | -304.4 | -424.9 | -593.1 | -828.0 |
| Capital Expenditure, % | -3.22 | -4 | -4.6 | -4.04 | -2.9 | -3.75 | -3.75 | -3.75 | -3.75 | -3.75 |
| Tax Rate, % | 31.4 | 31.4 | 31.4 | 31.4 | 31.4 | 31.4 | 31.4 | 31.4 | 31.4 | 31.4 |
| EBITAT | 313.3 | 67.6 | 31.7 | 283.1 | 443.9 | 404.7 | 564.9 | 788.6 | 1,101.0 | 1,537.0 |
| Depreciation | ||||||||||
| Changes in Account Receivables | ||||||||||
| Changes in Inventories | ||||||||||
| Changes in Accounts Payable | ||||||||||
| Capital Expenditure | ||||||||||
| UFCF | -27.9 | 8.6 | -278.5 | 166.0 | 679.9 | -503.8 | -7.3 | -10.1 | -14.1 | -19.7 |
| WACC, % | 10.92 | 10.41 | 9.01 | 10.46 | 10.13 | 10.18 | 10.18 | 10.18 | 10.18 | 10.18 |
| PV UFCF | ||||||||||
| SUM PV UFCF | -492.5 | |||||||||
| Long Term Growth Rate, % | 4.00 | |||||||||
| Free cash flow (T + 1) | -21 | |||||||||
| Terminal Value | -332 | |||||||||
| Present Terminal Value | -204 | |||||||||
| Enterprise Value | -697 | |||||||||
| Net Debt | 3,333 | |||||||||
| Equity Value | -4,030 | |||||||||
| Diluted Shares Outstanding, MM | 47 | |||||||||
| Equity Value Per Share | -86.35 |
What You Will Get
- Editable Excel Template: A fully customizable Excel-based DCF Calculator featuring pre-filled real GTLS financials.
- Real-World Data: Historical data and forward-looking estimates (highlighted in the yellow cells).
- Forecast Flexibility: Adjust forecast assumptions such as revenue growth, EBITDA %, and WACC.
- Automatic Calculations: Instantly observe how your inputs affect Chart Industries’ valuation.
- Professional Tool: Designed for investors, CFOs, consultants, and financial analysts.
- User-Friendly Design: Organized for clarity and ease of use, complete with step-by-step instructions.
Key Features
- Comprehensive GTLS Data: Loaded with Chart Industries' historical performance metrics and future outlook estimates.
- Flexible Input Options: Modify assumptions for revenue growth, profit margins, discount rates, tax implications, and capital investments.
- Interactive Valuation Framework: Instantaneously refresh Net Present Value (NPV) and intrinsic value as per your adjustments.
- Scenario Analysis: Develop various forecasting scenarios to evaluate different valuation possibilities.
- User-Centric Interface: Intuitive, organized, and tailored for both experts and newcomers.
How It Works
- Download the Template: Gain immediate access to the Excel-based GTLS DCF Calculator.
- Input Your Assumptions: Modify the yellow-highlighted cells for growth rates, WACC, margins, and other variables.
- Instant Calculations: The model automatically recalculates Chart Industries' intrinsic value.
- Test Scenarios: Experiment with various assumptions to see how they affect valuation outcomes.
- Analyze and Decide: Leverage the results to inform your investment or financial analysis.
Why Choose This Calculator for Chart Industries, Inc. (GTLS)?
- Designed for Experts: A sophisticated tool utilized by financial analysts, CFOs, and industry consultants.
- Comprehensive Data: Chart Industries’ historical and projected financial information preloaded for enhanced accuracy.
- Flexible Scenario Testing: Effortlessly simulate various forecasts and assumptions.
- Insightful Outputs: Automatically computes intrinsic value, NPV, and essential financial metrics.
- User-Friendly: Step-by-step guidance ensures a smooth calculation process.
Who Should Use This Product?
- Investors: Accurately assess Chart Industries, Inc.'s (GTLS) intrinsic value to inform investment choices.
- CFOs: Utilize a sophisticated DCF model for comprehensive financial reporting and analysis.
- Consultants: Efficiently customize the template for client valuation reports.
- Entrepreneurs: Acquire knowledge of financial modeling techniques employed by leading companies.
- Educators: Implement it as a resource for teaching valuation methods and practices.
What the Template Contains
- Preloaded GTLS Data: Historical and projected financial data, including revenue, EBIT, and capital expenditures.
- DCF and WACC Models: Professional-grade sheets for calculating intrinsic value and Weighted Average Cost of Capital.
- Editable Inputs: Yellow-highlighted cells for adjusting revenue growth, tax rates, and discount rates.
- Financial Statements: Comprehensive annual and quarterly financials for deeper analysis.
- Key Ratios: Profitability, leverage, and efficiency ratios to evaluate performance.
- Dashboard and Charts: Visual summaries of valuation outcomes and assumptions.
Disclaimer
All information, articles, and product details provided on this website are for general informational and educational purposes only. We do not claim any ownership over, nor do we intend to infringe upon, any trademarks, copyrights, logos, brand names, or other intellectual property mentioned or depicted on this site. Such intellectual property remains the property of its respective owners, and any references here are made solely for identification or informational purposes, without implying any affiliation, endorsement, or partnership.
We make no representations or warranties, express or implied, regarding the accuracy, completeness, or suitability of any content or products presented. Nothing on this website should be construed as legal, tax, investment, financial, medical, or other professional advice. In addition, no part of this site—including articles or product references—constitutes a solicitation, recommendation, endorsement, advertisement, or offer to buy or sell any securities, franchises, or other financial instruments, particularly in jurisdictions where such activity would be unlawful.
All content is of a general nature and may not address the specific circumstances of any individual or entity. It is not a substitute for professional advice or services. Any actions you take based on the information provided here are strictly at your own risk. You accept full responsibility for any decisions or outcomes arising from your use of this website and agree to release us from any liability in connection with your use of, or reliance upon, the content or products found herein.