
|
Gulf Resources, Inc. (GURE) DCF -Bewertung |
Fully Editable: Tailor To Your Needs In Excel Or Sheets
Professional Design: Trusted, Industry-Standard Templates
Investor-Approved Valuation Models
MAC/PC Compatible, Fully Unlocked
No Expertise Is Needed; Easy To Follow
Gulf Resources, Inc. (GURE) Bundle
Erforschen Sie den finanziellen Ausblick von Gulf Resources, Inc. (GURE) mit unserem benutzerfreundlichen DCF-Taschenrechner! Geben Sie Ihre Projektionen für Wachstum, Margen und Kosten ein, um den inneren Wert von Gulf Resources, Inc. (GURE) zu berechnen und Ihren Investitionsansatz zu verfeinern.
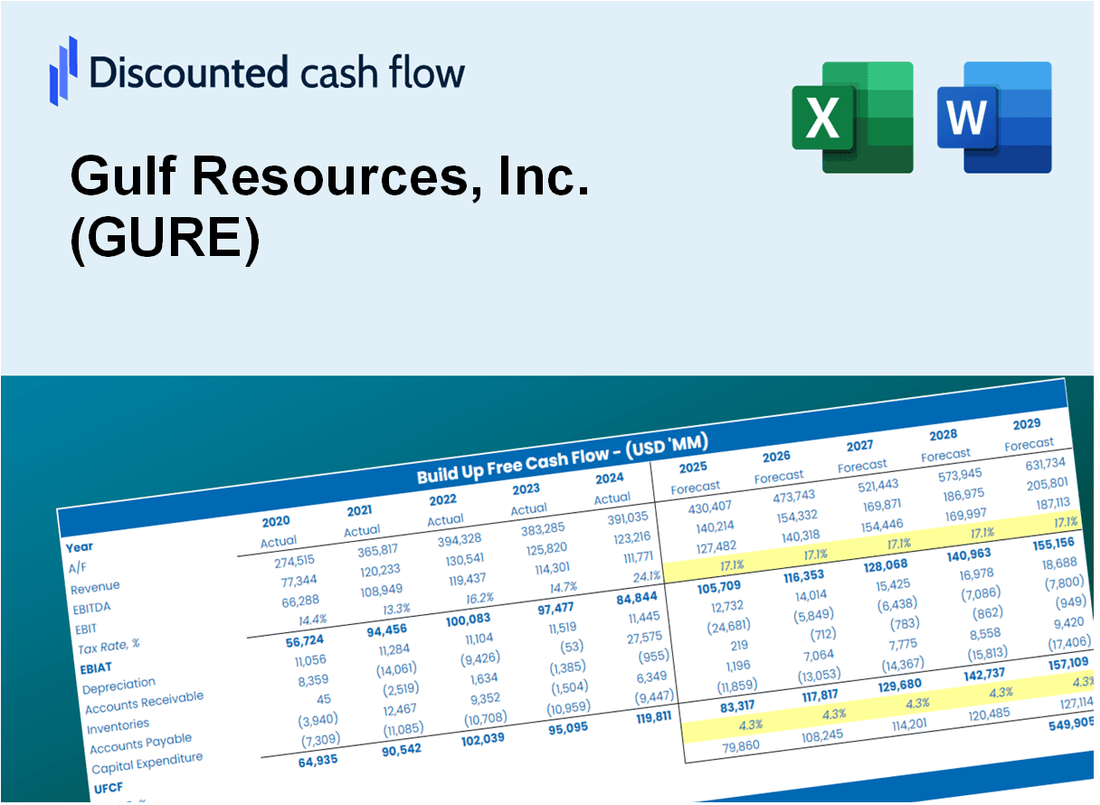
Discounted Cash Flow (DCF) - (USD MM)
| Year | AY1 2020 |
AY2 2021 |
AY3 2022 |
AY4 2023 |
AY5 2024 |
FY1 2025 |
FY2 2026 |
FY3 2027 |
FY4 2028 |
FY5 2029 |
|---|---|---|---|---|---|---|---|---|---|---|
| Revenue | 28.2 | 55.0 | 66.1 | 30.0 | 7.7 | 7.4 | 7.1 | 6.9 | 6.7 | 6.4 |
| Revenue Growth, % | 0 | 95.1 | 20.11 | -54.54 | -74.5 | -3.46 | -3.46 | -3.46 | -3.46 | -3.46 |
| EBITDA | 1.1 | 17.7 | 29.0 | -30.0 | -38.2 | -1.8 | -1.7 | -1.7 | -1.6 | -1.5 |
| EBITDA, % | 3.84 | 32.23 | 43.93 | -99.94 | -498.86 | -23.99 | -23.99 | -23.99 | -23.99 | -23.99 |
| Depreciation | 10.5 | 12.2 | 12.3 | 28.1 | 19.0 | 4.0 | 3.9 | 3.7 | 3.6 | 3.5 |
| Depreciation, % | 37.14 | 22.21 | 18.56 | 93.61 | 247.72 | 54.3 | 54.3 | 54.3 | 54.3 | 54.3 |
| EBIT | -9.4 | 5.5 | 16.8 | -58.2 | -57.2 | -2.9 | -2.8 | -2.7 | -2.6 | -2.5 |
| EBIT, % | -33.3 | 10.01 | 25.37 | -193.55 | -746.59 | -39.58 | -39.58 | -39.58 | -39.58 | -39.58 |
| Total Cash | 94.2 | 95.8 | 108.2 | 72.2 | 10.1 | 7.4 | 7.1 | 6.9 | 6.7 | 6.4 |
| Total Cash, percent | .0 | .0 | .0 | .0 | .0 | .0 | .0 | .0 | .0 | .0 |
| Account Receivables | 6.5 | 14.5 | 5.4 | 4.9 | .7 | 1.2 | 1.2 | 1.1 | 1.1 | 1.1 |
| Account Receivables, % | 23.12 | 26.4 | 8.12 | 16.22 | 8.92 | 16.56 | 16.56 | 16.56 | 16.56 | 16.56 |
| Inventories | .4 | .7 | 1.6 | .6 | .3 | .2 | .2 | .2 | .1 | .1 |
| Inventories, % | 1.49 | 1.26 | 2.42 | 1.92 | 4.12 | 2.24 | 2.24 | 2.24 | 2.24 | 2.24 |
| Accounts Payable | .5 | .2 | .1 | .2 | .0 | .0 | .0 | .0 | .0 | .0 |
| Accounts Payable, % | 1.7 | 0.36759 | 0.0872221 | 0.68894 | 0.39163 | 0.64739 | 0.64739 | 0.64739 | 0.64739 | 0.64739 |
| Capital Expenditure | -21.7 | -30.1 | -37.6 | .0 | -60.5 | -4.3 | -4.1 | -4.0 | -3.8 | -3.7 |
| Capital Expenditure, % | -77 | -54.68 | -56.83 | 0.000003328503 | -790.06 | -57.7 | -57.7 | -57.7 | -57.7 | -57.7 |
| Tax Rate, % | -2.88 | -2.88 | -2.88 | -2.88 | -2.88 | -2.88 | -2.88 | -2.88 | -2.88 | -2.88 |
| EBITAT | -8.3 | -.9 | 10.1 | -61.7 | -58.8 | -2.0 | -2.0 | -1.9 | -1.8 | -1.8 |
| Depreciation | ||||||||||
| Changes in Account Receivables | ||||||||||
| Changes in Inventories | ||||||||||
| Changes in Accounts Payable | ||||||||||
| Capital Expenditure | ||||||||||
| UFCF | -26.0 | -27.4 | -7.0 | -31.9 | -96.1 | -2.7 | -2.2 | -2.1 | -2.0 | -2.0 |
| WACC, % | 3.96 | 1.94 | 3.33 | 4.23 | 4.23 | 3.54 | 3.54 | 3.54 | 3.54 | 3.54 |
| PV UFCF | ||||||||||
| SUM PV UFCF | -9.9 | |||||||||
| Long Term Growth Rate, % | 2.00 | |||||||||
| Free cash flow (T + 1) | -2 | |||||||||
| Terminal Value | -129 | |||||||||
| Present Terminal Value | -109 | |||||||||
| Enterprise Value | -119 | |||||||||
| Net Debt | -1 | |||||||||
| Equity Value | -117 | |||||||||
| Diluted Shares Outstanding, MM | 1 | |||||||||
| Equity Value Per Share | -109.23 |
What You Will Get
- Real Gulf Resources Data: Preloaded financials – covering everything from revenue to EBIT – based on actual and projected figures.
- Full Customization: Modify all essential parameters (yellow cells) such as WACC, growth %, and tax rates.
- Instant Valuation Updates: Automatic recalculations to assess the impact of changes on Gulf Resources’ fair value.
- Versatile Excel Template: Designed for quick modifications, scenario testing, and comprehensive projections.
- Time-Saving and Accurate: Avoid the hassle of building models from scratch while ensuring precision and adaptability.
Key Features
- Accurate Gulf Resources Financials: Gain access to reliable pre-loaded historical data and future forecasts.
- Adjustable Forecast Parameters: Modify highlighted cells for WACC, growth rates, and profit margins.
- Real-Time Calculations: Instant updates to DCF, Net Present Value (NPV), and cash flow assessments.
- User-Friendly Dashboard: Clear charts and summaries to help visualize your valuation outcomes.
- Designed for All Levels: An intuitive layout tailored for investors, CFOs, and consultants alike.
How It Works
- Step 1: Download the Excel file for Gulf Resources, Inc. (GURE).
- Step 2: Review the pre-filled financial data and forecasts for Gulf Resources.
- Step 3: Adjust key inputs such as revenue growth, WACC, and tax rates (highlighted cells).
- Step 4: Observe the DCF model update in real-time as you modify your assumptions.
- Step 5: Evaluate the outputs and leverage the results for your investment strategies.
Why Choose This Calculator for Gulf Resources, Inc. (GURE)?
- Accurate Data: Up-to-date Gulf Resources financials provide trustworthy valuation outcomes.
- Customizable: Modify essential parameters such as growth rates, WACC, and tax rates to align with your forecasts.
- Time-Saving: Pre-configured calculations save you the hassle of starting from the ground up.
- Professional-Grade Tool: Tailored for investors, analysts, and consultants working with Gulf Resources.
- User-Friendly: Easy-to-navigate design and clear instructions make it accessible for all users.
Who Should Use This Product?
- Investors: Accurately assess Gulf Resources, Inc.'s (GURE) fair value prior to making investment choices.
- CFOs: Utilize a high-quality DCF model for financial reporting and analysis of Gulf Resources, Inc. (GURE).
- Consultants: Efficiently customize the template for valuation reports tailored to Gulf Resources, Inc. (GURE) clients.
- Entrepreneurs: Discover financial modeling techniques employed by leading companies like Gulf Resources, Inc. (GURE).
- Educators: Implement it as an educational resource to illustrate valuation methodologies using Gulf Resources, Inc. (GURE) as a case study.
What the Template Contains
- Pre-Filled DCF Model: Gulf Resources, Inc. (GURE)’s financial data preloaded for immediate use.
- WACC Calculator: Detailed calculations for Weighted Average Cost of Capital.
- Financial Ratios: Evaluate Gulf Resources, Inc. (GURE)’s profitability, leverage, and efficiency.
- Editable Inputs: Change assumptions such as growth, margins, and CAPEX to fit your scenarios.
- Financial Statements: Annual and quarterly reports to support detailed analysis.
- Interactive Dashboard: Easily visualize key valuation metrics and results.
Disclaimer
All information, articles, and product details provided on this website are for general informational and educational purposes only. We do not claim any ownership over, nor do we intend to infringe upon, any trademarks, copyrights, logos, brand names, or other intellectual property mentioned or depicted on this site. Such intellectual property remains the property of its respective owners, and any references here are made solely for identification or informational purposes, without implying any affiliation, endorsement, or partnership.
We make no representations or warranties, express or implied, regarding the accuracy, completeness, or suitability of any content or products presented. Nothing on this website should be construed as legal, tax, investment, financial, medical, or other professional advice. In addition, no part of this site—including articles or product references—constitutes a solicitation, recommendation, endorsement, advertisement, or offer to buy or sell any securities, franchises, or other financial instruments, particularly in jurisdictions where such activity would be unlawful.
All content is of a general nature and may not address the specific circumstances of any individual or entity. It is not a substitute for professional advice or services. Any actions you take based on the information provided here are strictly at your own risk. You accept full responsibility for any decisions or outcomes arising from your use of this website and agree to release us from any liability in connection with your use of, or reliance upon, the content or products found herein.