
|
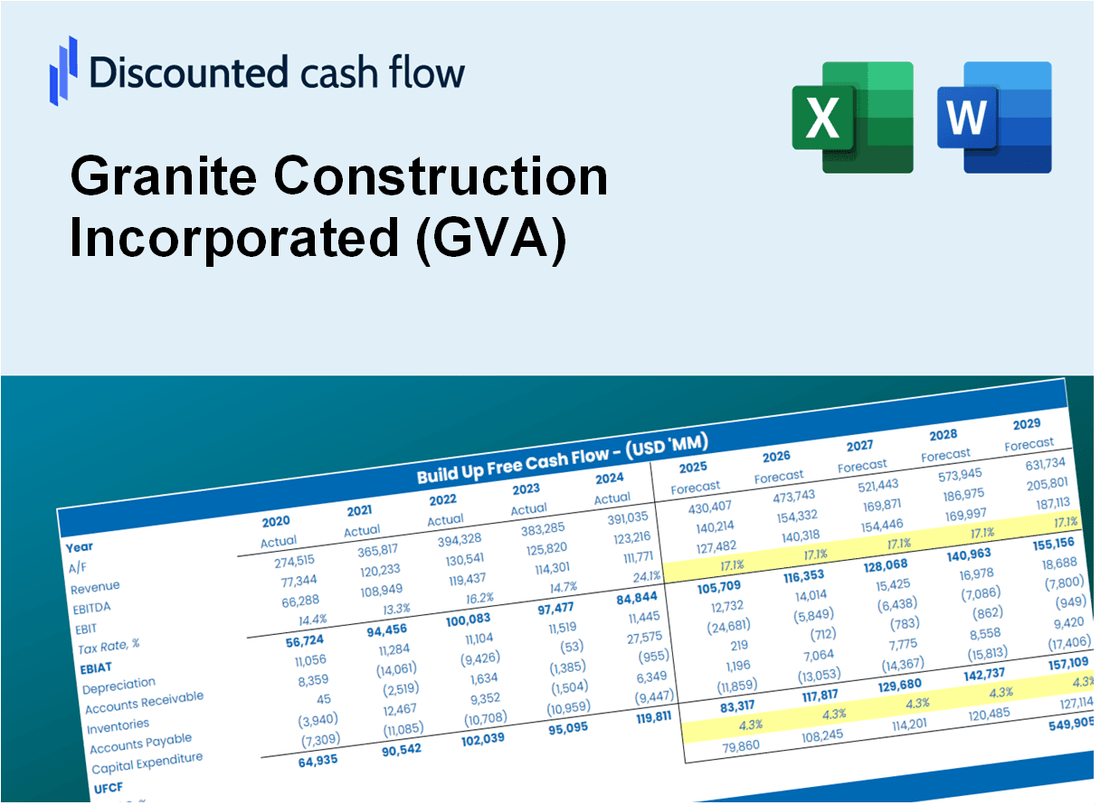
DCF -Bewertung von Granit Construction Incorporated (GVA) |
Fully Editable: Tailor To Your Needs In Excel Or Sheets
Professional Design: Trusted, Industry-Standard Templates
Investor-Approved Valuation Models
MAC/PC Compatible, Fully Unlocked
No Expertise Is Needed; Easy To Follow
Granite Construction Incorporated (GVA) Bundle
Bewerten Sie die finanziellen Aussichten von Granite Construction Incorporated wie ein Experte! Dieser DCF-Taschenrechner (GVA) bietet Ihnen vorgefüllte Finanzdaten und die Flexibilität, das Umsatzwachstum, WACC, Margen und andere wesentliche Annahmen zu ändern, um sich an Ihren Vorhersagen zu übereinstimmen.
What You Will Get
- Comprehensive GVA Financials: Access to historical and projected data for precise valuation.
- Customizable Inputs: Adjust WACC, tax rates, revenue growth, and capital expenditures as needed.
- Dynamic Calculations: Intrinsic value and NPV are computed in real-time.
- Scenario Analysis: Explore various scenarios to assess Granite Construction's future performance.
- User-Friendly Design: Crafted for professionals while remaining accessible to newcomers.
Key Features
- Comprehensive DCF Calculator: Offers detailed unlevered and levered DCF valuation models tailored for Granite Construction Incorporated (GVA).
- WACC Calculator: Features a pre-constructed Weighted Average Cost of Capital sheet with adjustable inputs specific to the construction industry.
- Customizable Forecast Assumptions: Easily adjust growth projections, capital expenditures, and discount rates to fit Granite Construction's financial outlook.
- Integrated Financial Ratios: Evaluate profitability, leverage, and efficiency ratios pertinent to Granite Construction Incorporated (GVA).
- Interactive Dashboard and Charts: Visual representations summarize essential valuation metrics for streamlined analysis.
How It Works
- Step 1: Download the prebuilt Excel template featuring Granite Construction Incorporated's (GVA) data.
- Step 2: Review the pre-filled sheets to familiarize yourself with the essential metrics.
- Step 3: Modify forecasts and assumptions in the editable yellow cells (WACC, growth, margins).
- Step 4: Instantly see recalculated results, including Granite Construction Incorporated's (GVA) intrinsic value.
- Step 5: Make well-informed investment decisions or create reports based on the results.
Why Choose This Calculator for Granite Construction Incorporated (GVA)?
- Designed for Industry Experts: A sophisticated tool utilized by engineers, project managers, and financial analysts.
- Comprehensive Data: Granite Construction’s historical and projected financials are preloaded for precision.
- Flexible Scenario Analysis: Effortlessly test various forecasts and assumptions.
- Insightful Outputs: Automatically computes intrinsic value, NPV, and essential performance metrics.
- User-Friendly: Step-by-step guidance ensures a smooth navigation through the process.
Who Should Use This Product?
- Investors: Make informed decisions by accurately estimating Granite Construction's fair value before investing.
- CFOs: Utilize a sophisticated DCF model for financial reporting and strategic analysis at Granite Construction (GVA).
- Consultants: Efficiently customize the template for client valuation reports related to Granite Construction (GVA).
- Entrepreneurs: Discover financial modeling techniques employed by industry leaders like Granite Construction (GVA).
- Educators: Implement this tool to teach valuation methodologies in a practical context, using Granite Construction (GVA) as a case study.
What the Template Contains
- Preloaded GVA Data: Historical and projected financial data, including revenue, EBIT, and capital expenditures.
- DCF and WACC Models: Professional-grade sheets for calculating intrinsic value and Weighted Average Cost of Capital.
- Editable Inputs: Yellow-highlighted cells for adjusting revenue growth, tax rates, and discount rates.
- Financial Statements: Comprehensive annual and quarterly financials for deeper analysis.
- Key Ratios: Profitability, leverage, and efficiency ratios to evaluate performance.
- Dashboard and Charts: Visual summaries of valuation outcomes and assumptions.
Disclaimer
All information, articles, and product details provided on this website are for general informational and educational purposes only. We do not claim any ownership over, nor do we intend to infringe upon, any trademarks, copyrights, logos, brand names, or other intellectual property mentioned or depicted on this site. Such intellectual property remains the property of its respective owners, and any references here are made solely for identification or informational purposes, without implying any affiliation, endorsement, or partnership.
We make no representations or warranties, express or implied, regarding the accuracy, completeness, or suitability of any content or products presented. Nothing on this website should be construed as legal, tax, investment, financial, medical, or other professional advice. In addition, no part of this site—including articles or product references—constitutes a solicitation, recommendation, endorsement, advertisement, or offer to buy or sell any securities, franchises, or other financial instruments, particularly in jurisdictions where such activity would be unlawful.
All content is of a general nature and may not address the specific circumstances of any individual or entity. It is not a substitute for professional advice or services. Any actions you take based on the information provided here are strictly at your own risk. You accept full responsibility for any decisions or outcomes arising from your use of this website and agree to release us from any liability in connection with your use of, or reliance upon, the content or products found herein.