
|
Guidewire Software, Inc. (GWRE) DCF -Bewertung |
Fully Editable: Tailor To Your Needs In Excel Or Sheets
Professional Design: Trusted, Industry-Standard Templates
Investor-Approved Valuation Models
MAC/PC Compatible, Fully Unlocked
No Expertise Is Needed; Easy To Follow
Guidewire Software, Inc. (GWRE) Bundle
Optimieren Sie Ihre Analyse und verbessern Sie die Präzision mit unserem DCF -Taschenrechner von Guidewire Software, Inc. (GWRE)! Mithilfe realer Daten von Guidewire und anpassbaren Annahmen können Sie dieses Tool wie ein erfahrener Investor prognostizieren, analysieren und Value Guidewire haben.
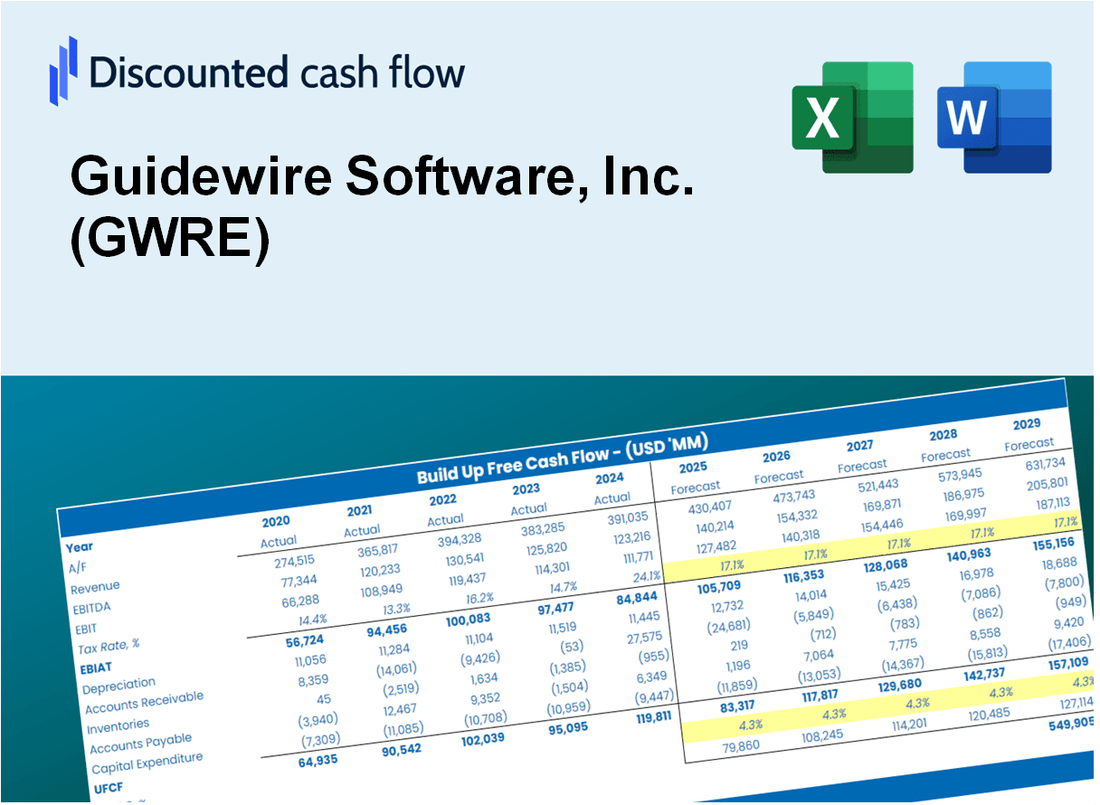
Discounted Cash Flow (DCF) - (USD MM)
| Year | AY1 2021 |
AY2 2022 |
AY3 2023 |
AY4 2024 |
AY5 2025 |
FY1 2026 |
FY2 2027 |
FY3 2028 |
FY4 2029 |
FY5 2030 |
|---|---|---|---|---|---|---|---|---|---|---|
| Revenue | 743.3 | 812.6 | 905.3 | 980.5 | 1,202.5 | 1,357.8 | 1,533.2 | 1,731.3 | 1,955.0 | 2,207.6 |
| Revenue Growth, % | 0 | 9.33 | 11.41 | 8.3 | 22.64 | 12.92 | 12.92 | 12.92 | 12.92 | 12.92 |
| EBITDA | -48.6 | -176.7 | -102.5 | 2.2 | 86.4 | -87.5 | -98.8 | -111.5 | -125.9 | -142.2 |
| EBITDA, % | -6.54 | -21.75 | -11.33 | 0.22529 | 7.18 | -6.44 | -6.44 | -6.44 | -6.44 | -6.44 |
| Depreciation | 37.0 | 33.5 | 24.8 | 22.3 | 23.8 | 43.7 | 49.4 | 55.7 | 62.9 | 71.1 |
| Depreciation, % | 4.97 | 4.13 | 2.74 | 2.28 | 1.98 | 3.22 | 3.22 | 3.22 | 3.22 | 3.22 |
| EBIT | -85.6 | -210.3 | -127.4 | -20.1 | 62.6 | -131.2 | -148.1 | -167.3 | -188.9 | -213.3 |
| EBIT, % | -11.51 | -25.88 | -14.07 | -2.05 | 5.21 | -9.66 | -9.66 | -9.66 | -9.66 | -9.66 |
| Total Cash | 1,119.4 | 976.2 | 798.7 | 1,003.6 | 1,149.4 | 1,313.9 | 1,483.6 | 1,675.3 | 1,891.7 | 2,136.1 |
| Total Cash, percent | .0 | .0 | .0 | .0 | .0 | .0 | .0 | .0 | .0 | .0 |
| Account Receivables | 192.9 | 227.5 | 256.5 | 242.2 | 271.6 | 351.8 | 397.3 | 448.6 | 506.6 | 572.0 |
| Account Receivables, % | 25.96 | 27.99 | 28.33 | 24.7 | 22.59 | 25.91 | 25.91 | 25.91 | 25.91 | 25.91 |
| Inventories | .0 | .0 | .0 | .0 | .0 | .0 | .0 | .0 | .0 | .0 |
| Inventories, % | 0 | 0 | 0 | 0 | 0 | 0 | 0 | 0 | 0 | 0 |
| Accounts Payable | 27.8 | 40.4 | 34.6 | 15.2 | 28.8 | 44.8 | 50.6 | 57.1 | 64.5 | 72.8 |
| Accounts Payable, % | 3.74 | 4.98 | 3.82 | 1.55 | 2.39 | 3.3 | 3.3 | 3.3 | 3.3 | 3.3 |
| Capital Expenditure | -28.9 | -21.8 | -17.4 | -18.5 | -5.7 | -29.5 | -33.3 | -37.6 | -42.4 | -47.9 |
| Capital Expenditure, % | -3.88 | -2.68 | -1.92 | -1.89 | -0.47744 | -2.17 | -2.17 | -2.17 | -2.17 | -2.17 |
| Tax Rate, % | -41.32 | -41.32 | -41.32 | -41.32 | -41.32 | -41.32 | -41.32 | -41.32 | -41.32 | -41.32 |
| EBITAT | -54.6 | -165.2 | -106.3 | -4.6 | 88.5 | -91.4 | -103.2 | -116.6 | -131.6 | -148.6 |
| Depreciation | ||||||||||
| Changes in Account Receivables | ||||||||||
| Changes in Inventories | ||||||||||
| Changes in Accounts Payable | ||||||||||
| Capital Expenditure | ||||||||||
| UFCF | -211.6 | -175.3 | -133.7 | -5.9 | 90.7 | -141.4 | -126.8 | -143.2 | -161.7 | -182.6 |
| WACC, % | 8.57 | 8.59 | 8.59 | 8.51 | 8.62 | 8.57 | 8.57 | 8.57 | 8.57 | 8.57 |
| PV UFCF | ||||||||||
| SUM PV UFCF | -587.2 | |||||||||
| Long Term Growth Rate, % | 2.00 | |||||||||
| Free cash flow (T + 1) | -186 | |||||||||
| Terminal Value | -2,833 | |||||||||
| Present Terminal Value | -1,878 | |||||||||
| Enterprise Value | -2,465 | |||||||||
| Net Debt | 7 | |||||||||
| Equity Value | -2,472 | |||||||||
| Diluted Shares Outstanding, MM | 86 | |||||||||
| Equity Value Per Share | -28.78 |
What You Will Get
- Editable Excel Template: A fully customizable Excel-based DCF Calculator featuring pre-filled real GWRE financials.
- Real-World Data: Historical data and forward-looking estimates (as highlighted in the yellow cells).
- Forecast Flexibility: Adjust forecast assumptions such as revenue growth, EBITDA %, and WACC.
- Automatic Calculations: Instantly observe the impact of your inputs on Guidewire Software’s valuation.
- Professional Tool: Designed for investors, CFOs, consultants, and financial analysts.
- User-Friendly Design: Organized for clarity and ease of use, complete with step-by-step instructions.
Key Features
- 🔍 Real-Life GWRE Financials: Pre-filled historical and projected data for Guidewire Software, Inc.
- ✏️ Fully Customizable Inputs: Adjust all critical parameters (yellow cells) like WACC, growth %, and tax rates.
- 📊 Professional DCF Valuation: Built-in formulas calculate Guidewire’s intrinsic value using the Discounted Cash Flow method.
- ⚡ Instant Results: Visualize Guidewire’s valuation instantly after making changes.
- Scenario Analysis: Test and compare outcomes for various financial assumptions side-by-side.
How It Works
- Step 1: Download the Excel file for Guidewire Software, Inc. (GWRE).
- Step 2: Review the pre-filled financial data and forecasts provided for Guidewire.
- Step 3: Adjust key inputs such as revenue growth, WACC, and tax rates (highlighted cells).
- Step 4: Observe the DCF model update in real-time as you modify your assumptions.
- Step 5: Evaluate the outputs and leverage the results for your investment strategies.
Why Choose This Calculator for Guidewire Software, Inc. (GWRE)?
- Precision: Utilizing accurate Guidewire financial data for reliable results.
- Adaptability: Built to allow users to easily adjust and experiment with inputs.
- Efficiency: Eliminate the complexity of creating a DCF model from the ground up.
- Expert-Level: Crafted with the expertise and usability expected by financial professionals.
- Intuitive: Designed for ease of use, suitable for users without extensive financial modeling skills.
Who Should Use Guidewire Software, Inc. (GWRE)?
- Insurance Professionals: Enhance your understanding of policy administration and claims management with practical insights.
- Academics: Integrate industry-leading software solutions into your research and teaching methodologies.
- Investors: Evaluate your investment strategies by analyzing the performance and market trends of Guidewire Software.
- Data Analysts: Optimize your analytical processes with customizable tools tailored for the insurance industry.
- IT Managers: Discover how large-scale software implementations can transform operational efficiency in insurance companies.
What the Guidewire Template Contains
- Comprehensive DCF Model: Editable template featuring detailed valuation calculations tailored for Guidewire Software, Inc. (GWRE).
- Real-World Data: Guidewire’s historical and projected financials preloaded for in-depth analysis.
- Customizable Parameters: Adjust WACC, growth rates, and tax assumptions to explore various scenarios.
- Financial Statements: Complete annual and quarterly breakdowns for enhanced insights.
- Key Ratios: Integrated analysis for profitability, efficiency, and leverage metrics.
- Dashboard with Visual Outputs: Charts and tables designed for clear, actionable results.
Disclaimer
All information, articles, and product details provided on this website are for general informational and educational purposes only. We do not claim any ownership over, nor do we intend to infringe upon, any trademarks, copyrights, logos, brand names, or other intellectual property mentioned or depicted on this site. Such intellectual property remains the property of its respective owners, and any references here are made solely for identification or informational purposes, without implying any affiliation, endorsement, or partnership.
We make no representations or warranties, express or implied, regarding the accuracy, completeness, or suitability of any content or products presented. Nothing on this website should be construed as legal, tax, investment, financial, medical, or other professional advice. In addition, no part of this site—including articles or product references—constitutes a solicitation, recommendation, endorsement, advertisement, or offer to buy or sell any securities, franchises, or other financial instruments, particularly in jurisdictions where such activity would be unlawful.
All content is of a general nature and may not address the specific circumstances of any individual or entity. It is not a substitute for professional advice or services. Any actions you take based on the information provided here are strictly at your own risk. You accept full responsibility for any decisions or outcomes arising from your use of this website and agree to release us from any liability in connection with your use of, or reliance upon, the content or products found herein.