
|
Hafnia Limited (HAFN) DCF -Bewertung |
Fully Editable: Tailor To Your Needs In Excel Or Sheets
Professional Design: Trusted, Industry-Standard Templates
Investor-Approved Valuation Models
MAC/PC Compatible, Fully Unlocked
No Expertise Is Needed; Easy To Follow
Hafnia Limited (HAFN) Bundle
Möchten Sie den inneren Wert von Hafnia Limited bewerten? Unser (HAFN) DCF-Taschenrechner integriert reale Daten mit umfangreichen Anpassungsfunktionen, sodass Sie Prognosen anpassen und Ihre Anlagestrategien verbessern können.
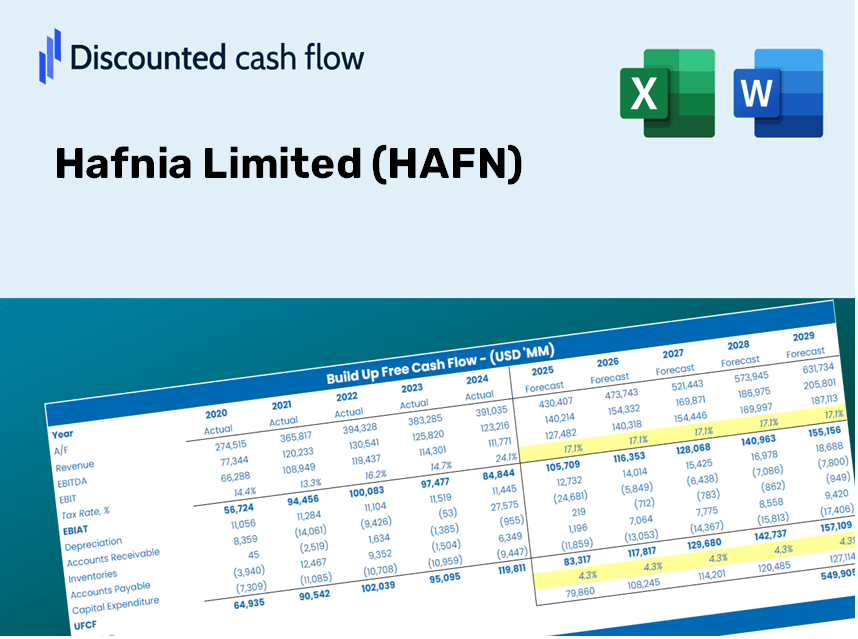
Discounted Cash Flow (DCF) - (USD MM)
| Year | AY1 2020 |
AY2 2021 |
AY3 2022 |
AY4 2023 |
AY5 2024 |
FY1 2025 |
FY2 2026 |
FY3 2027 |
FY4 2028 |
FY5 2029 |
|---|---|---|---|---|---|---|---|---|---|---|
| Revenue | 961.0 | 790.0 | 1,889.6 | 2,671.7 | 2,868.6 | 3,807.9 | 5,054.6 | 6,709.5 | 8,906.3 | 11,822.3 |
| Revenue Growth, % | 0 | -17.8 | 139.19 | 41.39 | 7.37 | 32.74 | 32.74 | 32.74 | 32.74 | 32.74 |
| EBITDA | 387.0 | 135.6 | 948.0 | 1,127.6 | 992.3 | 1,404.4 | 1,864.2 | 2,474.5 | 3,284.7 | 4,360.2 |
| EBITDA, % | 40.27 | 17.17 | 50.17 | 42.21 | 34.59 | 36.88 | 36.88 | 36.88 | 36.88 | 36.88 |
| Depreciation | 172.0 | 147.7 | 205.2 | 219.0 | 215.1 | 480.9 | 638.4 | 847.4 | 1,124.9 | 1,493.2 |
| Depreciation, % | 17.9 | 18.7 | 10.86 | 8.2 | 7.5 | 12.63 | 12.63 | 12.63 | 12.63 | 12.63 |
| EBIT | 215.0 | -12.1 | 742.7 | 908.6 | 777.2 | 923.4 | 1,225.8 | 1,627.1 | 2,159.8 | 2,867.0 |
| EBIT, % | 22.38 | -1.53 | 39.31 | 34.01 | 27.09 | 24.25 | 24.25 | 24.25 | 24.25 | 24.25 |
| Total Cash | 100.7 | 99.9 | 281.5 | 141.6 | 195.3 | 381.8 | 506.8 | 672.7 | 893.0 | 1,185.4 |
| Total Cash, percent | .0 | .0 | .0 | .0 | .0 | .0 | .0 | .0 | .0 | .0 |
| Account Receivables | 158.9 | 226.4 | 483.6 | 566.8 | 487.7 | 830.1 | 1,101.9 | 1,462.7 | 1,941.6 | 2,577.3 |
| Account Receivables, % | 16.54 | 28.66 | 25.59 | 21.21 | 17 | 21.8 | 21.8 | 21.8 | 21.8 | 21.8 |
| Inventories | 5.2 | 6.7 | 90.3 | 107.7 | 94.2 | 102.7 | 136.3 | 180.9 | 240.1 | 318.7 |
| Inventories, % | 0.544 | 0.8421 | 4.78 | 4.03 | 3.28 | 2.7 | 2.7 | 2.7 | 2.7 | 2.7 |
| Accounts Payable | 23.8 | 94.9 | 41.5 | 220.0 | 193.4 | 241.2 | 320.1 | 424.9 | 564.0 | 748.7 |
| Accounts Payable, % | 2.48 | 12.02 | 2.2 | 8.23 | 6.74 | 6.33 | 6.33 | 6.33 | 6.33 | 6.33 |
| Capital Expenditure | -53.4 | -26.3 | -438.8 | -184.4 | -49.6 | -310.3 | -411.9 | -546.7 | -725.8 | -963.4 |
| Capital Expenditure, % | -5.56 | -3.33 | -23.22 | -6.9 | -1.73 | -8.15 | -8.15 | -8.15 | -8.15 | -8.15 |
| Tax Rate, % | 0.56754 | 0.56754 | 0.56754 | 0.56754 | 0.56754 | 0.56754 | 0.56754 | 0.56754 | 0.56754 | 0.56754 |
| EBITAT | 198.8 | -13.6 | 775.3 | 901.5 | 772.8 | 907.0 | 1,203.9 | 1,598.1 | 2,121.3 | 2,815.9 |
| Depreciation | ||||||||||
| Changes in Account Receivables | ||||||||||
| Changes in Inventories | ||||||||||
| Changes in Accounts Payable | ||||||||||
| Capital Expenditure | ||||||||||
| UFCF | 177.0 | 110.0 | 147.4 | 1,014.0 | 1,004.4 | 774.4 | 1,204.0 | 1,598.2 | 2,121.4 | 2,816.0 |
| WACC, % | 4.76 | 4.86 | 4.86 | 4.85 | 4.86 | 4.84 | 4.84 | 4.84 | 4.84 | 4.84 |
| PV UFCF | ||||||||||
| SUM PV UFCF | 7,200.6 | |||||||||
| Long Term Growth Rate, % | 2.00 | |||||||||
| Free cash flow (T + 1) | 2,872 | |||||||||
| Terminal Value | 101,191 | |||||||||
| Present Terminal Value | 79,898 | |||||||||
| Enterprise Value | 87,099 | |||||||||
| Net Debt | 927 | |||||||||
| Equity Value | 86,172 | |||||||||
| Diluted Shares Outstanding, MM | 515 | |||||||||
| Equity Value Per Share | 167.29 |
What You Will Receive
- Accurate HAFN Financials: Contains historical data and future forecasts for precise valuation.
- Customizable Inputs: Adjust WACC, tax rates, revenue growth, and capital expenditures as needed.
- Automated Calculations: Intrinsic value and NPV are computed in real-time.
- Scenario Analysis: Explore various scenarios to assess Hafnia Limited's future performance.
- User-Friendly Design: Crafted for professionals, yet easy to navigate for newcomers.
Key Features
- Customizable Forecast Inputs: Adjust essential metrics such as revenue growth, EBITDA margin, and capital expenditures.
- Instant DCF Valuation: Automatically calculates intrinsic value, net present value, and other key outputs within moments.
- High-Precision Accuracy: Leverages Hafnia Limited’s real-world financial data for realistic valuation results.
- Effortless Scenario Analysis: Easily evaluate various assumptions and compare different outcomes.
- Time-Efficient Solution: Avoid the hassle of constructing intricate valuation models from the ground up.
How It Works
- Step 1: Download the prebuilt Excel template featuring Hafnia Limited’s (HAFN) data.
- Step 2: Review the pre-filled sheets to familiarize yourself with key performance metrics.
- Step 3: Modify forecasts and assumptions in the editable yellow cells (WACC, growth, margins).
- Step 4: Instantly access recalculated results, including the intrinsic value of Hafnia Limited (HAFN).
- Step 5: Utilize the outputs to make informed investment decisions or generate comprehensive reports.
Why Select This Calculator for Hafnia Limited (HAFN)?
- All-in-One Solution: Features DCF, WACC, and a variety of financial ratio analyses all in one tool.
- Adjustable Parameters: Modify the yellow-highlighted fields to explore different scenarios.
- In-Depth Analysis: Automatically computes Hafnia's intrinsic value and Net Present Value.
- Preloaded Information: Comes with historical and projected data for reliable calculations.
- High-Quality Insights: Perfect for financial analysts, investors, and business advisors focused on Hafnia Limited.
Who Can Benefit from This Product?
- Finance Students: Master valuation methods and apply them with real-world data.
- Academics: Integrate professional models into your lectures or research studies.
- Investors: Validate your investment hypotheses and evaluate the valuation results for Hafnia Limited (HAFN).
- Analysts: Enhance your efficiency with a ready-to-use, customizable DCF model.
- Small Business Owners: Understand how major public companies like Hafnia Limited (HAFN) are assessed.
Contents of the Template
- Comprehensive DCF Model: An editable template featuring detailed valuation calculations.
- Real-World Data: Preloaded historical and projected financials for Hafnia Limited (HAFN) to facilitate analysis.
- Customizable Parameters: Modify WACC, growth rates, and tax assumptions to explore various scenarios.
- Financial Statements: Complete annual and quarterly breakdowns for enhanced insights.
- Key Ratios: Integrated analysis for profitability, efficiency, and leverage metrics.
- Dashboard with Visual Outputs: Graphs and tables providing clear and actionable results.
Disclaimer
All information, articles, and product details provided on this website are for general informational and educational purposes only. We do not claim any ownership over, nor do we intend to infringe upon, any trademarks, copyrights, logos, brand names, or other intellectual property mentioned or depicted on this site. Such intellectual property remains the property of its respective owners, and any references here are made solely for identification or informational purposes, without implying any affiliation, endorsement, or partnership.
We make no representations or warranties, express or implied, regarding the accuracy, completeness, or suitability of any content or products presented. Nothing on this website should be construed as legal, tax, investment, financial, medical, or other professional advice. In addition, no part of this site—including articles or product references—constitutes a solicitation, recommendation, endorsement, advertisement, or offer to buy or sell any securities, franchises, or other financial instruments, particularly in jurisdictions where such activity would be unlawful.
All content is of a general nature and may not address the specific circumstances of any individual or entity. It is not a substitute for professional advice or services. Any actions you take based on the information provided here are strictly at your own risk. You accept full responsibility for any decisions or outcomes arising from your use of this website and agree to release us from any liability in connection with your use of, or reliance upon, the content or products found herein.