
|
Havells India Limited (Havells.NS) DCF -Bewertung |
Fully Editable: Tailor To Your Needs In Excel Or Sheets
Professional Design: Trusted, Industry-Standard Templates
Investor-Approved Valuation Models
MAC/PC Compatible, Fully Unlocked
No Expertise Is Needed; Easy To Follow
Havells India Limited (HAVELLS.NS) Bundle
Unser (Havellsns) DCF-Taschenrechner wurde für die Genauigkeit entwickelt und ermöglicht es Ihnen, die Bewertung von Havells India Limited unter Verwendung realer Finanzdaten zu bewerten, und bietet vollständige Flexibilität, um alle wesentlichen Parameter für verbesserte Projektionen zu ändern.
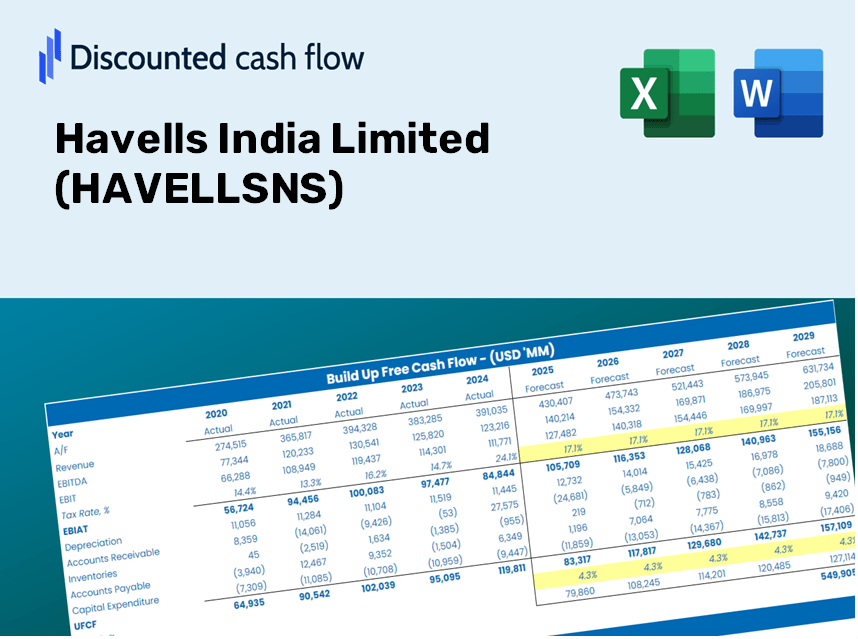
Discounted Cash Flow (DCF) - (USD MM)
| Year | AY1 2021 |
AY2 2022 |
AY3 2023 |
AY4 2024 |
AY5 2025 |
FY1 2026 |
FY2 2027 |
FY3 2028 |
FY4 2029 |
FY5 2030 |
|---|---|---|---|---|---|---|---|---|---|---|
| Revenue | 103,827.3 | 138,354.5 | 169,107.3 | 185,765.1 | 217,780.6 | 262,734.2 | 316,967.1 | 382,394.5 | 461,327.2 | 556,553.0 |
| Revenue Growth, % | 0 | 33.25 | 22.23 | 9.85 | 17.23 | 20.64 | 20.64 | 20.64 | 20.64 | 20.64 |
| EBITDA | 17,611.3 | 19,211.2 | 17,883.4 | 21,117.9 | 24,341.3 | 33,613.1 | 40,551.4 | 48,921.9 | 59,020.2 | 71,203.0 |
| EBITDA, % | 16.96 | 13.89 | 10.58 | 11.37 | 11.18 | 12.79 | 12.79 | 12.79 | 12.79 | 12.79 |
| Depreciation | 2,489.1 | 2,608.9 | 2,961.7 | 3,385.0 | 4,004.0 | 5,094.5 | 6,146.1 | 7,414.7 | 8,945.2 | 10,791.7 |
| Depreciation, % | 2.4 | 1.89 | 1.75 | 1.82 | 1.84 | 1.94 | 1.94 | 1.94 | 1.94 | 1.94 |
| EBIT | 15,122.2 | 16,602.3 | 14,921.7 | 17,732.9 | 20,337.3 | 28,518.6 | 34,405.3 | 41,507.2 | 50,074.9 | 60,411.3 |
| EBIT, % | 14.56 | 12 | 8.82 | 9.55 | 9.34 | 10.85 | 10.85 | 10.85 | 10.85 | 10.85 |
| Total Cash | 19,562.2 | 26,987.2 | 20,487.8 | 30,230.0 | 33,581.2 | 43,170.0 | 52,081.0 | 62,831.4 | 75,800.8 | 91,447.4 |
| Total Cash, percent | .0 | .0 | .0 | .0 | .0 | .0 | .0 | .0 | .0 | .0 |
| Account Receivables | 6,472.7 | 8,287.2 | 11,187.7 | 12,227.6 | 12,696.6 | 16,421.9 | 19,811.7 | 23,901.2 | 28,834.8 | 34,786.7 |
| Account Receivables, % | 6.23 | 5.99 | 6.62 | 6.58 | 5.83 | 6.25 | 6.25 | 6.25 | 6.25 | 6.25 |
| Inventories | 26,373.6 | 29,680.8 | 37,085.8 | 35,105.4 | 40,468.5 | 55,838.6 | 67,364.7 | 81,269.9 | 98,045.4 | 118,283.6 |
| Inventories, % | 25.4 | 21.45 | 21.93 | 18.9 | 18.58 | 21.25 | 21.25 | 21.25 | 21.25 | 21.25 |
| Accounts Payable | 16,369.4 | 24,109.2 | 21,184.4 | 26,919.0 | 31,380.2 | 39,209.8 | 47,303.4 | 57,067.7 | 68,847.4 | 83,058.7 |
| Accounts Payable, % | 15.77 | 17.43 | 12.53 | 14.49 | 14.41 | 14.92 | 14.92 | 14.92 | 14.92 | 14.92 |
| Capital Expenditure | -2,498.9 | -2,583.2 | -5,877.9 | -7,860.7 | -7,659.5 | -8,143.9 | -9,824.9 | -11,852.9 | -14,299.6 | -17,251.3 |
| Capital Expenditure, % | -2.41 | -1.87 | -3.48 | -4.23 | -3.52 | -3.1 | -3.1 | -3.1 | -3.1 | -3.1 |
| Tax Rate, % | 26.04 | 26.04 | 26.04 | 26.04 | 26.04 | 26.04 | 26.04 | 26.04 | 26.04 | 26.04 |
| EBITAT | 10,985.5 | 12,364.4 | 11,051.4 | 13,198.2 | 15,042.4 | 21,079.5 | 25,430.6 | 30,680.0 | 37,012.8 | 44,652.9 |
| Depreciation | ||||||||||
| Changes in Account Receivables | ||||||||||
| Changes in Inventories | ||||||||||
| Changes in Accounts Payable | ||||||||||
| Capital Expenditure | ||||||||||
| UFCF | -5,501.2 | 15,008.2 | -5,095.1 | 15,397.6 | 10,016.0 | 6,764.3 | 14,929.6 | 18,011.3 | 21,729.1 | 26,214.4 |
| WACC, % | 5.44 | 5.44 | 5.44 | 5.44 | 5.44 | 5.44 | 5.44 | 5.44 | 5.44 | 5.44 |
| PV UFCF | ||||||||||
| SUM PV UFCF | 72,906.1 | |||||||||
| Long Term Growth Rate, % | 4.00 | |||||||||
| Free cash flow (T + 1) | 27,263 | |||||||||
| Terminal Value | 1,894,559 | |||||||||
| Present Terminal Value | 1,453,790 | |||||||||
| Enterprise Value | 1,526,696 | |||||||||
| Net Debt | -4,887 | |||||||||
| Equity Value | 1,531,583 | |||||||||
| Diluted Shares Outstanding, MM | 627 | |||||||||
| Equity Value Per Share | 2,442.61 |
Benefits You'll Receive
- Accurate HAVELLS Financials: Access to both historical data and forecasts for precise valuation.
- Customizable Parameters: Adjust WACC, tax rates, revenue growth, and capital expenditures as needed.
- Dynamic Calculations: Intrinsic value and NPV are computed automatically.
- Comprehensive Scenario Analysis: Explore various scenarios to assess Havells India Limited's future performance.
- User-Friendly Design: Tailored for professionals while remaining approachable for newcomers.
Key Features
- Pre-Loaded Data: Historical financial statements and forecasts for Havells India Limited (HAVELLSNS).
- Fully Adjustable Inputs: Customize variables such as WACC, tax rates, revenue growth, and EBITDA margins.
- Instant Results: View the intrinsic value of Havells India Limited (HAVELLSNS) recalculating in real time.
- Clear Visual Outputs: Dashboard charts present valuation outcomes and essential metrics clearly.
- Built for Accuracy: A professional-grade tool designed for analysts, investors, and finance professionals.
How It Functions
- Step 1: Download the Excel spreadsheet.
- Step 2: Examine the pre-filled data for Havells India Limited (HAVELLSNS) including historical and projected information.
- Step 3: Modify the key assumptions (highlighted in yellow) based on your evaluation.
- Step 4: Observe the automatic recalculations reflecting the intrinsic value of Havells India Limited (HAVELLSNS).
- Step 5: Utilize the results for your investment strategies or reporting purposes.
Why Opt for This Calculator?
- Reliable Data: Accurate financial figures from Havells India Limited ensure dependable valuation outcomes.
- Flexible Options: Tailor key inputs such as growth rates, WACC, and tax rates to fit your forecasts.
- Efficient: Built-in calculations save you the hassle of beginning from the ground up.
- Professional-Quality Tool: Crafted specifically for investors, analysts, and consultants.
- Easy to Use: User-friendly design and clear step-by-step guidance make it accessible for everyone.
Who Can Benefit from Havells India Limited (HAVELLSNS)?
- Investors: Gain assurance in your investment choices with a top-tier valuation tool.
- Financial Analysts: Streamline your workflow with a customizable DCF model designed for efficiency.
- Consultants: Quickly modify the template for impactful client presentations or detailed reports.
- Finance Enthusiasts: Enhance your knowledge of valuation methodologies through practical, real-world examples.
- Educators and Students: Utilize this resource as a hands-on learning aid in finance-related educational programs.
Contents of the Template
- Historical Data: Contains Havells India Limited’s previous financial records and foundational forecasts.
- DCF and Levered DCF Models: Comprehensive templates designed to assess Havells India Limited’s intrinsic value.
- WACC Sheet: Pre-configured calculations for Weighted Average Cost of Capital.
- Editable Inputs: Adjust essential drivers such as growth rates, EBITDA percentages, and CAPEX projections.
- Quarterly and Annual Statements: A thorough analysis of Havells India Limited’s financial performance.
- Interactive Dashboard: Dynamically visualize valuation outcomes and forecasts.
Disclaimer
All information, articles, and product details provided on this website are for general informational and educational purposes only. We do not claim any ownership over, nor do we intend to infringe upon, any trademarks, copyrights, logos, brand names, or other intellectual property mentioned or depicted on this site. Such intellectual property remains the property of its respective owners, and any references here are made solely for identification or informational purposes, without implying any affiliation, endorsement, or partnership.
We make no representations or warranties, express or implied, regarding the accuracy, completeness, or suitability of any content or products presented. Nothing on this website should be construed as legal, tax, investment, financial, medical, or other professional advice. In addition, no part of this site—including articles or product references—constitutes a solicitation, recommendation, endorsement, advertisement, or offer to buy or sell any securities, franchises, or other financial instruments, particularly in jurisdictions where such activity would be unlawful.
All content is of a general nature and may not address the specific circumstances of any individual or entity. It is not a substitute for professional advice or services. Any actions you take based on the information provided here are strictly at your own risk. You accept full responsibility for any decisions or outcomes arising from your use of this website and agree to release us from any liability in connection with your use of, or reliance upon, the content or products found herein.