
|
Hindustan Construction Company Limited (HCC.NS) DCF -Bewertung |
Fully Editable: Tailor To Your Needs In Excel Or Sheets
Professional Design: Trusted, Industry-Standard Templates
Investor-Approved Valuation Models
MAC/PC Compatible, Fully Unlocked
No Expertise Is Needed; Easy To Follow
Hindustan Construction Company Limited (HCC.NS) Bundle
Vereinfachen Sie die Bewertung der Hindustan Construction Company Limited (HCCNS) mit diesem anpassbaren DCF -Taschenrechner! Mit Real Hindustan Construction Company Limited (HCCNS) -Fonds und einstellbaren Prognoseeingaben können Sie Szenarien testen und Hindustan Construction Company Limited (HCCNS) in Minuten aufdecken.
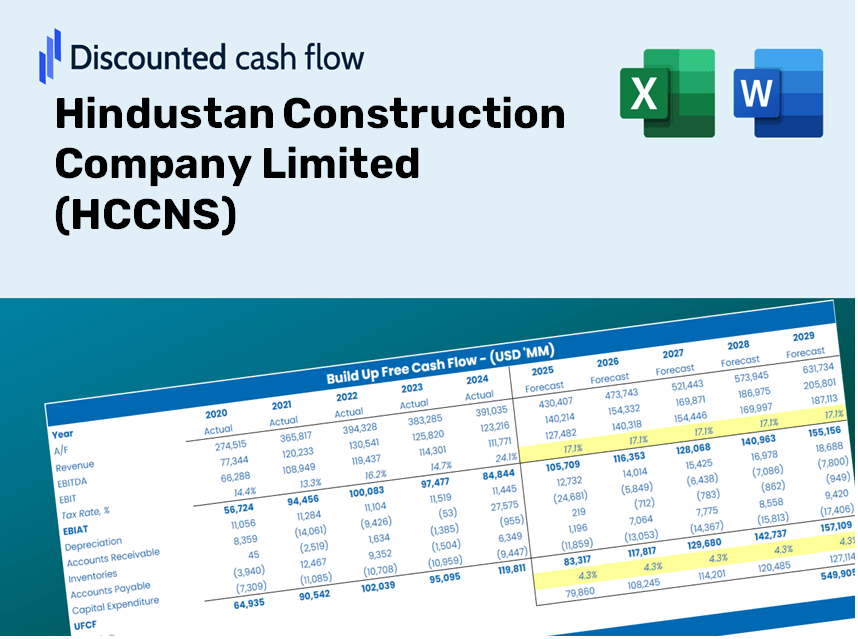
Discounted Cash Flow (DCF) - (USD MM)
| Year | AY1 2021 |
AY2 2022 |
AY3 2023 |
AY4 2024 |
AY5 2025 |
FY1 2026 |
FY2 2027 |
FY3 2028 |
FY4 2029 |
FY5 2030 |
|---|---|---|---|---|---|---|---|---|---|---|
| Revenue | 82,484.2 | 102,211.4 | 77,150.8 | 70,310.3 | 56,033.7 | 51,862.9 | 48,002.5 | 44,429.5 | 41,122.4 | 38,061.5 |
| Revenue Growth, % | 0 | 23.92 | -24.52 | -8.87 | -20.31 | -7.44 | -7.44 | -7.44 | -7.44 | -7.44 |
| EBITDA | 2,221.8 | 18,066.2 | 9,601.7 | 16,354.2 | 7,937.5 | 7,285.7 | 6,743.4 | 6,241.4 | 5,776.9 | 5,346.9 |
| EBITDA, % | 2.69 | 17.68 | 12.45 | 23.26 | 14.17 | 14.05 | 14.05 | 14.05 | 14.05 | 14.05 |
| Depreciation | 1,355.1 | 1,383.1 | 1,276.4 | 1,051.0 | 1,639.8 | 941.0 | 870.9 | 806.1 | 746.1 | 690.6 |
| Depreciation, % | 1.64 | 1.35 | 1.65 | 1.49 | 2.93 | 1.81 | 1.81 | 1.81 | 1.81 | 1.81 |
| EBIT | 866.7 | 16,683.1 | 8,325.3 | 15,303.2 | 6,297.7 | 6,344.7 | 5,872.5 | 5,435.3 | 5,030.8 | 4,656.3 |
| EBIT, % | 1.05 | 16.32 | 10.79 | 21.77 | 11.24 | 12.23 | 12.23 | 12.23 | 12.23 | 12.23 |
| Total Cash | 12,617.7 | 17,033.2 | 11,542.4 | 5,132.7 | 7,519.8 | 7,016.3 | 6,494.1 | 6,010.7 | 5,563.3 | 5,149.2 |
| Total Cash, percent | .0 | .0 | .0 | .0 | .0 | .0 | .0 | .0 | .0 | .0 |
| Account Receivables | 83,686.0 | 60,701.8 | 56,911.6 | 56,614.2 | 47,108.4 | 41,256.6 | 38,185.7 | 35,343.4 | 32,712.7 | 30,277.7 |
| Account Receivables, % | 101.46 | 59.39 | 73.77 | 80.52 | 84.07 | 79.55 | 79.55 | 79.55 | 79.55 | 79.55 |
| Inventories | 4,796.0 | 4,848.4 | 4,905.2 | 4,363.1 | 1,280.0 | 2,635.2 | 2,439.1 | 2,257.5 | 2,089.5 | 1,934.0 |
| Inventories, % | 5.81 | 4.74 | 6.36 | 6.21 | 2.28 | 5.08 | 5.08 | 5.08 | 5.08 | 5.08 |
| Accounts Payable | 30,474.2 | 30,585.4 | 29,912.1 | 24,734.9 | 20,924.3 | 18,480.0 | 17,104.5 | 15,831.3 | 14,652.9 | 13,562.2 |
| Accounts Payable, % | 36.95 | 29.92 | 38.77 | 35.18 | 37.34 | 35.63 | 35.63 | 35.63 | 35.63 | 35.63 |
| Capital Expenditure | -748.1 | -892.5 | -2,153.7 | -186.3 | -178.5 | -534.7 | -494.9 | -458.1 | -424.0 | -392.4 |
| Capital Expenditure, % | -0.90696 | -0.87319 | -2.79 | -0.26497 | -0.31856 | -1.03 | -1.03 | -1.03 | -1.03 | -1.03 |
| Tax Rate, % | 78.47 | 78.47 | 78.47 | 78.47 | 78.47 | 78.47 | 78.47 | 78.47 | 78.47 | 78.47 |
| EBITAT | 609.6 | 14,732.2 | 2,601.9 | 9,409.8 | 1,355.8 | 3,463.1 | 3,205.3 | 2,966.7 | 2,745.9 | 2,541.5 |
| Depreciation | ||||||||||
| Changes in Account Receivables | ||||||||||
| Changes in Inventories | ||||||||||
| Changes in Accounts Payable | ||||||||||
| Capital Expenditure | ||||||||||
| UFCF | -56,791.2 | 38,265.8 | 4,784.7 | 5,936.8 | 11,595.4 | 5,921.5 | 5,472.8 | 5,065.4 | 4,688.4 | 4,339.4 |
| WACC, % | 10.83 | 12.51 | 7.17 | 10 | 6.26 | 9.35 | 9.35 | 9.35 | 9.35 | 9.35 |
| PV UFCF | ||||||||||
| SUM PV UFCF | 19,919.3 | |||||||||
| Long Term Growth Rate, % | 2.00 | |||||||||
| Free cash flow (T + 1) | 4,426 | |||||||||
| Terminal Value | 60,198 | |||||||||
| Present Terminal Value | 38,498 | |||||||||
| Enterprise Value | 58,417 | |||||||||
| Net Debt | 9,707 | |||||||||
| Equity Value | 48,710 | |||||||||
| Diluted Shares Outstanding, MM | 1,707 | |||||||||
| Equity Value Per Share | 28.54 |
What You Will Receive
- Real HCCNS Financial Data: Comes pre-loaded with HCC’s historical and forecasted data for accurate analysis.
- Completely Customizable Template: Effortlessly adjust key metrics like revenue growth, WACC, and EBITDA percentage.
- Instant Calculations: Witness updates to HCC’s intrinsic value in real-time as you make modifications.
- Professional Valuation Tool: Tailored for investors, analysts, and consultants in pursuit of precise DCF assessments.
- User-Friendly Interface: Intuitive layout and straightforward instructions suitable for all skill levels.
Key Features
- Pre-Loaded Data: Comprehensive historical financial statements and pre-filled forecasts for Hindustan Construction Company Limited (HCCNS).
- Fully Adjustable Inputs: Customize WACC, tax rates, revenue growth, and EBITDA margins as per your analysis.
- Instant Results: View the intrinsic value of Hindustan Construction Company Limited (HCCNS) recalculated in real-time.
- Clear Visual Outputs: Engaging dashboard charts that visualize valuation outcomes and essential metrics.
- Built for Accuracy: A reliable tool designed for analysts, investors, and finance professionals.
How It Functions
- Step 1: Download the Excel file.
- Step 2: Examine the pre-populated data for Hindustan Construction Company Limited (HCCNS) (HCC).
- Step 3: Modify the key assumptions (highlighted in yellow) according to your analysis.
- Step 4: Observe the automatic recalculations reflecting the intrinsic value of Hindustan Construction Company Limited (HCCNS) (HCC).
- Step 5: Utilize the results to inform your investment choices or reporting needs.
Why Opt for HCCNS’s Calculator?
- Efficient Use of Time: Skip the hassle of building a DCF model from the ground up – our tool is ready for immediate use.
- Enhanced Accuracy: Dependable financial data and formulas minimize valuation errors.
- Completely Customizable: Adjust the model to align with your unique assumptions and forecasts.
- Simple to Understand: Intuitive charts and outputs facilitate easy result analysis.
- Endorsed by Professionals: Crafted for experts who prioritize accuracy and functionality.
Who Can Benefit from This Product?
- Individual Investors: Make informed decisions regarding the buying or selling of Hindustan Construction Company Limited (HCCNS) shares.
- Financial Analysts: Enhance valuation processes with comprehensive financial models tailored for (HCCNS).
- Consultants: Provide clients with accurate and timely valuation insights related to (HCCNS).
- Business Owners: Gain insights into how major firms like Hindustan Construction Company are valued to inform your own strategic decisions.
- Finance Students: Acquire practical knowledge of valuation methods using real-time data and case studies involving (HCCNS).
Contents of the Template
- Operating and Balance Sheet Data: Pre-filled historical data and forecasts for Hindustan Construction Company Limited (HCCNS), including revenue, EBITDA, EBIT, and capital expenditures.
- WACC Calculation: A dedicated sheet for the Weighted Average Cost of Capital (WACC), featuring parameters such as Beta, risk-free rate, and share price.
- DCF Valuation (Unlevered and Levered): Customizable Discounted Cash Flow models that detail intrinsic value with comprehensive calculations.
- Financial Statements: Pre-loaded annual and quarterly financial statements to facilitate thorough analysis.
- Key Ratios: Includes profitability, leverage, and efficiency ratios specific to Hindustan Construction Company Limited (HCCNS).
- Dashboard and Charts: Visual representations of valuation outputs and assumptions for effortless result analysis.
Disclaimer
All information, articles, and product details provided on this website are for general informational and educational purposes only. We do not claim any ownership over, nor do we intend to infringe upon, any trademarks, copyrights, logos, brand names, or other intellectual property mentioned or depicted on this site. Such intellectual property remains the property of its respective owners, and any references here are made solely for identification or informational purposes, without implying any affiliation, endorsement, or partnership.
We make no representations or warranties, express or implied, regarding the accuracy, completeness, or suitability of any content or products presented. Nothing on this website should be construed as legal, tax, investment, financial, medical, or other professional advice. In addition, no part of this site—including articles or product references—constitutes a solicitation, recommendation, endorsement, advertisement, or offer to buy or sell any securities, franchises, or other financial instruments, particularly in jurisdictions where such activity would be unlawful.
All content is of a general nature and may not address the specific circumstances of any individual or entity. It is not a substitute for professional advice or services. Any actions you take based on the information provided here are strictly at your own risk. You accept full responsibility for any decisions or outcomes arising from your use of this website and agree to release us from any liability in connection with your use of, or reliance upon, the content or products found herein.