
|
DCF -Bewertung der Turtle Beach Corporation (Hear) |
Fully Editable: Tailor To Your Needs In Excel Or Sheets
Professional Design: Trusted, Industry-Standard Templates
Investor-Approved Valuation Models
MAC/PC Compatible, Fully Unlocked
No Expertise Is Needed; Easy To Follow
Turtle Beach Corporation (HEAR) Bundle
Entdecken Sie das finanzielle Potenzial von Turtle Beach Corporation (Hear) mit unserem benutzerfreundlichen DCF-Taschenrechner! Geben Sie Ihre Annahmen über Wachstum, Margen und Kosten für die Berechnung des inneren Werts der Turtle Beach Corporation (Hear) ein und verfeinern Sie Ihre Anlagestrategie.
What You Will Get
- Real Turtle Beach Data: Preloaded financials – from revenue to EBIT – based on actual and projected figures for Turtle Beach Corporation (HEAR).
- Full Customization: Adjust all critical parameters (yellow cells) like WACC, growth %, and tax rates to fit your analysis.
- Instant Valuation Updates: Automatic recalculations to assess the impact of changes on Turtle Beach's fair value.
- Versatile Excel Template: Designed for quick edits, scenario testing, and detailed projections specific to Turtle Beach Corporation (HEAR).
- Time-Saving and Accurate: Avoid building models from scratch while ensuring precision and flexibility in your financial assessments.
Key Features
- Pre-Loaded Data: Turtle Beach Corporation’s historical financial statements and pre-filled forecasts.
- Fully Adjustable Inputs: Modify WACC, tax rates, revenue growth, and EBITDA margins as needed.
- Instant Results: View Turtle Beach Corporation’s intrinsic value recalculating in real time.
- Clear Visual Outputs: Dashboard charts illustrate valuation results and essential metrics.
- Built for Accuracy: A professional tool designed for analysts, investors, and finance experts.
How It Works
- Download: Obtain the pre-built Excel file containing Turtle Beach Corporation’s (HEAR) financial data.
- Customize: Modify projections, such as revenue growth, EBITDA %, and WACC.
- Update Automatically: The intrinsic value and NPV calculations refresh in real-time.
- Test Scenarios: Develop various forecasts and instantly analyze the results.
- Make Decisions: Utilize the valuation outcomes to inform your investment approach.
Why Choose This Calculator for Turtle Beach Corporation (HEAR)?
- Designed for Industry Experts: A sophisticated tool favored by analysts, CFOs, and financial consultants.
- Comprehensive Data: Turtle Beach’s historical and projected financials are preloaded for precision.
- Scenario Analysis: Effortlessly test various forecasts and assumptions.
- Intuitive Outputs: Automatically computes intrinsic value, NPV, and essential metrics.
- User-Friendly: Step-by-step guidance ensures a smooth experience.
Who Should Use This Product?
- Professional Investors: Create comprehensive and trustworthy valuation models for analyzing Turtle Beach Corporation (HEAR) stock.
- Corporate Finance Teams: Evaluate valuation scenarios to inform strategic decisions within the company.
- Consultants and Advisors: Offer clients precise valuation insights for Turtle Beach Corporation (HEAR).
- Students and Educators: Utilize real-world data to enhance learning and practice in financial modeling.
- Gaming Industry Enthusiasts: Gain insights into how gaming companies like Turtle Beach Corporation (HEAR) are valued in the marketplace.
What the Template Contains
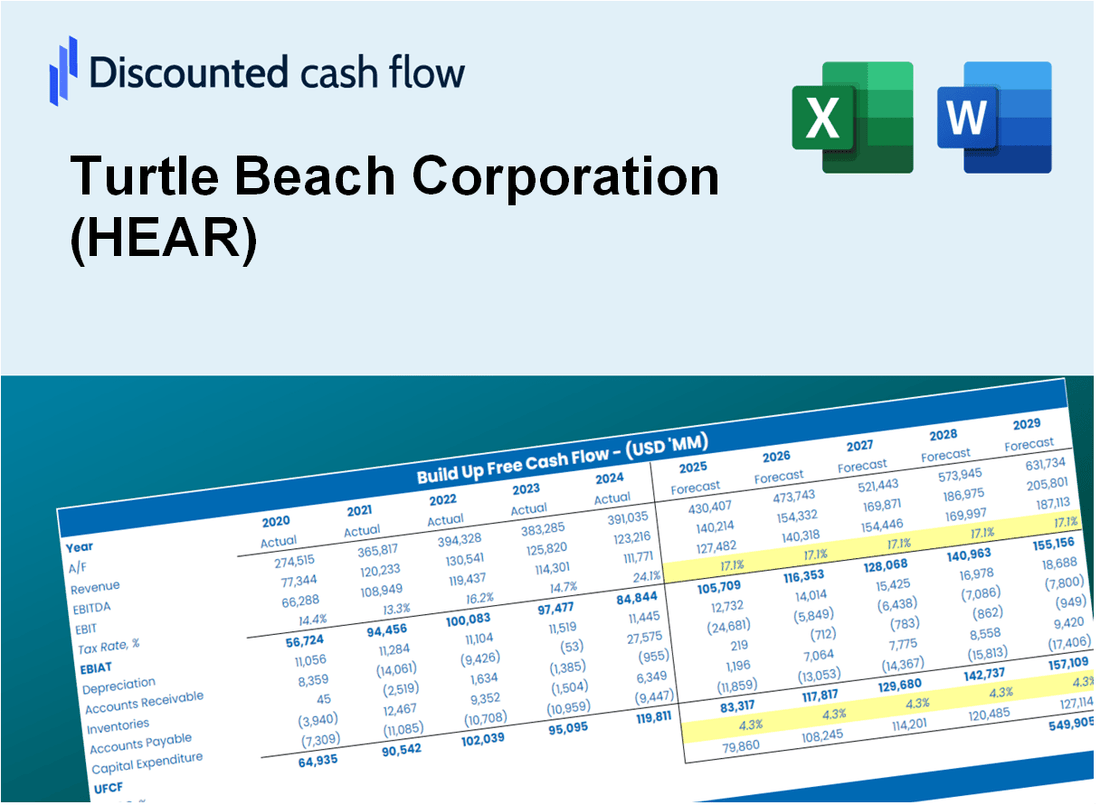
- Operating and Balance Sheet Data: Pre-filled Turtle Beach Corporation (HEAR) historical data and forecasts, including revenue, EBITDA, EBIT, and capital expenditures.
- WACC Calculation: A dedicated sheet for Weighted Average Cost of Capital (WACC), including parameters like Beta, risk-free rate, and share price.
- DCF Valuation (Unlevered and Levered): Editable Discounted Cash Flow models showing intrinsic value with detailed calculations.
- Financial Statements: Pre-loaded financial statements (annual and quarterly) to support analysis.
- Key Ratios: Includes profitability, leverage, and efficiency ratios for Turtle Beach Corporation (HEAR).
- Dashboard and Charts: Visual summary of valuation outputs and assumptions to analyze results easily.
Disclaimer
All information, articles, and product details provided on this website are for general informational and educational purposes only. We do not claim any ownership over, nor do we intend to infringe upon, any trademarks, copyrights, logos, brand names, or other intellectual property mentioned or depicted on this site. Such intellectual property remains the property of its respective owners, and any references here are made solely for identification or informational purposes, without implying any affiliation, endorsement, or partnership.
We make no representations or warranties, express or implied, regarding the accuracy, completeness, or suitability of any content or products presented. Nothing on this website should be construed as legal, tax, investment, financial, medical, or other professional advice. In addition, no part of this site—including articles or product references—constitutes a solicitation, recommendation, endorsement, advertisement, or offer to buy or sell any securities, franchises, or other financial instruments, particularly in jurisdictions where such activity would be unlawful.
All content is of a general nature and may not address the specific circumstances of any individual or entity. It is not a substitute for professional advice or services. Any actions you take based on the information provided here are strictly at your own risk. You accept full responsibility for any decisions or outcomes arising from your use of this website and agree to release us from any liability in connection with your use of, or reliance upon, the content or products found herein.