
|
Heijmans N.V. (Heijm.as) DCF -Bewertung |
Fully Editable: Tailor To Your Needs In Excel Or Sheets
Professional Design: Trusted, Industry-Standard Templates
Investor-Approved Valuation Models
MAC/PC Compatible, Fully Unlocked
No Expertise Is Needed; Easy To Follow
Heijmans N.V. (HEIJM.AS) Bundle
Sparen Sie Zeit und verbessern Sie die Präzision mit unserem (Heijmas) DCF -Taschenrechner! Mithilfe von realen Daten und anpassbaren Annahmen nutzen Sie dieses Tool und können Heijmans N.V. wie ein erfahrener Investor prognostizieren, analysieren und bewerten.
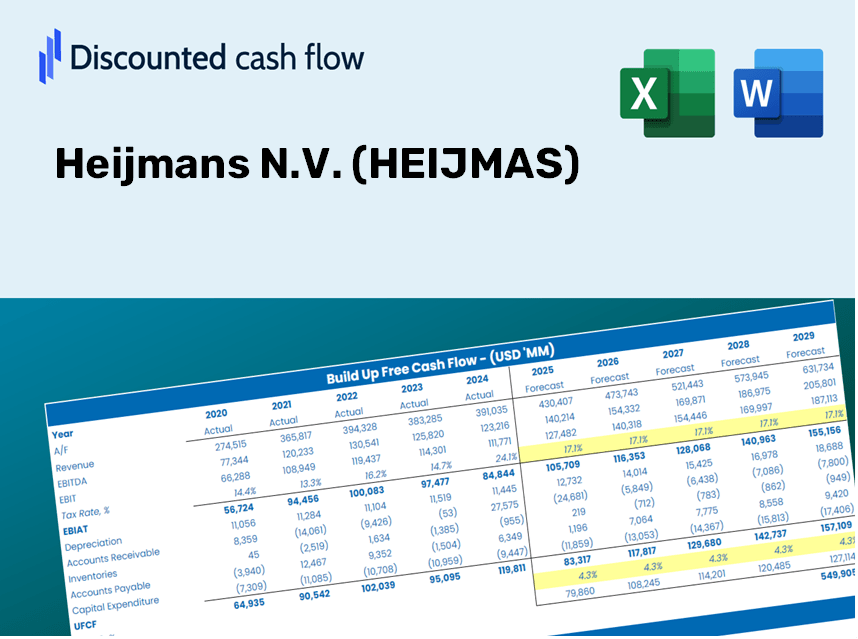
Discounted Cash Flow (DCF) - (USD MM)
| Year | AY1 2020 |
AY2 2021 |
AY3 2022 |
AY4 2023 |
AY5 2024 |
FY1 2025 |
FY2 2026 |
FY3 2027 |
FY4 2028 |
FY5 2029 |
|---|---|---|---|---|---|---|---|---|---|---|
| Revenue | 1,746.5 | 1,748.5 | 1,812.2 | 2,117.3 | 2,584.2 | 2,465.9 | 2,353.0 | 2,245.3 | 2,142.6 | 2,044.5 |
| Revenue Growth, % | 0 | 0.11543 | 3.64 | 16.84 | 22.05 | -4.58 | -4.58 | -4.58 | -4.58 | -4.58 |
| EBITDA | 91.1 | 89.6 | 117.6 | 135.3 | 179.3 | 148.7 | 141.9 | 135.4 | 129.2 | 123.3 |
| EBITDA, % | 5.22 | 5.13 | 6.49 | 6.39 | 6.94 | 6.03 | 6.03 | 6.03 | 6.03 | 6.03 |
| Depreciation | 34.1 | 33.8 | 40.9 | 46.0 | 60.6 | 52.6 | 50.2 | 47.9 | 45.7 | 43.6 |
| Depreciation, % | 1.95 | 1.93 | 2.26 | 2.17 | 2.35 | 2.13 | 2.13 | 2.13 | 2.13 | 2.13 |
| EBIT | 57.0 | 55.8 | 76.7 | 89.3 | 118.7 | 96.2 | 91.8 | 87.6 | 83.6 | 79.7 |
| EBIT, % | 3.27 | 3.19 | 4.23 | 4.22 | 4.59 | 3.9 | 3.9 | 3.9 | 3.9 | 3.9 |
| Total Cash | 175.1 | 209.6 | 237.0 | 37.1 | 102.6 | 201.3 | 192.1 | 183.3 | 174.9 | 166.9 |
| Total Cash, percent | .0 | .0 | .0 | .0 | .0 | .0 | .0 | .0 | .0 | .0 |
| Account Receivables | 132.8 | 170.6 | 233.5 | 220.0 | 205.0 | 239.5 | 228.6 | 218.1 | 208.1 | 198.6 |
| Account Receivables, % | 7.61 | 9.75 | 12.89 | 10.39 | 7.93 | 9.71 | 9.71 | 9.71 | 9.71 | 9.71 |
| Inventories | 281.6 | 259.8 | 268.5 | 528.4 | 468.0 | 438.3 | 418.2 | 399.1 | 380.8 | 363.4 |
| Inventories, % | 16.13 | 14.86 | 14.82 | 24.96 | 18.11 | 17.77 | 17.77 | 17.77 | 17.77 | 17.77 |
| Accounts Payable | 165.1 | 129.8 | 176.0 | 125.5 | 128.6 | 184.9 | 176.5 | 168.4 | 160.7 | 153.3 |
| Accounts Payable, % | 9.45 | 7.43 | 9.71 | 5.93 | 4.98 | 7.5 | 7.5 | 7.5 | 7.5 | 7.5 |
| Capital Expenditure | -16.4 | -25.6 | -24.5 | -43.9 | -30.4 | -34.5 | -32.9 | -31.4 | -30.0 | -28.6 |
| Capital Expenditure, % | -0.93721 | -1.46 | -1.35 | -2.07 | -1.18 | -1.4 | -1.4 | -1.4 | -1.4 | -1.4 |
| Tax Rate, % | 23.08 | 23.08 | 23.08 | 23.08 | 23.08 | 23.08 | 23.08 | 23.08 | 23.08 | 23.08 |
| EBITAT | 57.2 | 51.1 | 62.5 | 65.8 | 91.3 | 81.5 | 77.8 | 74.2 | 70.8 | 67.6 |
| Depreciation | ||||||||||
| Changes in Account Receivables | ||||||||||
| Changes in Inventories | ||||||||||
| Changes in Accounts Payable | ||||||||||
| Capital Expenditure | ||||||||||
| UFCF | -174.4 | 8.1 | 53.5 | -229.0 | 200.0 | 151.0 | 117.5 | 112.2 | 107.0 | 102.1 |
| WACC, % | 9.52 | 9.44 | 9.36 | 9.29 | 9.32 | 9.39 | 9.39 | 9.39 | 9.39 | 9.39 |
| PV UFCF | ||||||||||
| SUM PV UFCF | 462.0 | |||||||||
| Long Term Growth Rate, % | 0.50 | |||||||||
| Free cash flow (T + 1) | 103 | |||||||||
| Terminal Value | 1,155 | |||||||||
| Present Terminal Value | 737 | |||||||||
| Enterprise Value | 1,199 | |||||||||
| Net Debt | 13 | |||||||||
| Equity Value | 1,187 | |||||||||
| Diluted Shares Outstanding, MM | 27 | |||||||||
| Equity Value Per Share | 43.63 |
What You Will Receive
- Accurate HEIJMAS Financial Data: Pre-populated with Heijmans N.V.’s historical and forecasted figures for thorough analysis.
- Completely Customizable Template: Easily adjust critical inputs such as revenue growth, WACC, and EBITDA percentage.
- Instant Calculations: Watch as Heijmans N.V.’s intrinsic value updates in real-time with your modifications.
- Professional Valuation Resource: Tailored for investors, analysts, and consultants aiming for precise DCF outcomes.
- Intuitive Layout: Clear design and straightforward instructions suitable for users of all experience levels.
Key Features
- Genuine Heijmans Financials: Gain access to precise historical data and future forecasts tailored to Heijmans N.V. (HEIJMAS).
- Adjustable Forecast Parameters: Modify highlighted cells to update WACC, growth rates, and profit margins.
- Real-Time Calculations: Instant updates to DCF, Net Present Value (NPV), and cash flow assessments.
- Interactive Dashboard: User-friendly graphs and summaries for clear visualization of your valuation outcomes.
- Designed for All Users: An intuitive framework ideal for investors, financial executives, and consultants alike.
How It Operates
- Download: Obtain the ready-to-use Excel file featuring Heijmans N.V.'s (HEIJMAS) financial data.
- Customize: Modify forecasts such as revenue growth, EBITDA %, and WACC to suit your analysis.
- Update Automatically: Watch the intrinsic value and NPV calculations refresh in real-time.
- Test Scenarios: Develop various projections and instantly compare the results.
- Make Decisions: Leverage the valuation outcomes to inform your investment strategy.
Why Choose the Heijmans N.V. Calculator?
- Designed for Industry Experts: A sophisticated tool utilized by analysts, CFOs, and consultants in the construction sector.
- Accurate Financial Data: Heijmans’ historical and projected financial figures are preloaded for reliable insights.
- Versatile Scenario Analysis: Effortlessly test various forecasts and assumptions to gauge different outcomes.
- Insightful Results: Automatically computes intrinsic value, NPV, and other essential metrics.
- User-Friendly Interface: Step-by-step guidance leads you through the process seamlessly.
Who Can Benefit from This Product?
- Investors: Assess Heijmans N.V. (HEIJMAS) valuation before making investment decisions.
- CFOs and Financial Analysts: Optimize valuation methods and validate financial projections.
- Startup Founders: Understand the valuation strategies of established companies like Heijmans N.V. (HEIJMAS).
- Consultants: Provide detailed valuation reports to enhance client offerings.
- Students and Educators: Utilize real-world examples to teach and practice valuation methodologies.
Contents of the Template
- Operating and Balance Sheet Data: Pre-filled historical data and forecasts for Heijmans N.V. (HEIJMAS), including revenue, EBITDA, EBIT, and capital expenditures.
- WACC Calculation: A dedicated sheet for calculating the Weighted Average Cost of Capital (WACC), featuring parameters such as Beta, risk-free rate, and share price.
- DCF Valuation (Unlevered and Levered): Customizable Discounted Cash Flow models illustrating intrinsic value with comprehensive calculations.
- Financial Statements: Pre-loaded annual and quarterly financial statements to facilitate in-depth analysis.
- Key Ratios: Includes profitability, leverage, and efficiency ratios specific to Heijmans N.V. (HEIJMAS).
- Dashboard and Charts: Visual representation of valuation results and assumptions for straightforward analysis.
Disclaimer
All information, articles, and product details provided on this website are for general informational and educational purposes only. We do not claim any ownership over, nor do we intend to infringe upon, any trademarks, copyrights, logos, brand names, or other intellectual property mentioned or depicted on this site. Such intellectual property remains the property of its respective owners, and any references here are made solely for identification or informational purposes, without implying any affiliation, endorsement, or partnership.
We make no representations or warranties, express or implied, regarding the accuracy, completeness, or suitability of any content or products presented. Nothing on this website should be construed as legal, tax, investment, financial, medical, or other professional advice. In addition, no part of this site—including articles or product references—constitutes a solicitation, recommendation, endorsement, advertisement, or offer to buy or sell any securities, franchises, or other financial instruments, particularly in jurisdictions where such activity would be unlawful.
All content is of a general nature and may not address the specific circumstances of any individual or entity. It is not a substitute for professional advice or services. Any actions you take based on the information provided here are strictly at your own risk. You accept full responsibility for any decisions or outcomes arising from your use of this website and agree to release us from any liability in connection with your use of, or reliance upon, the content or products found herein.