
|
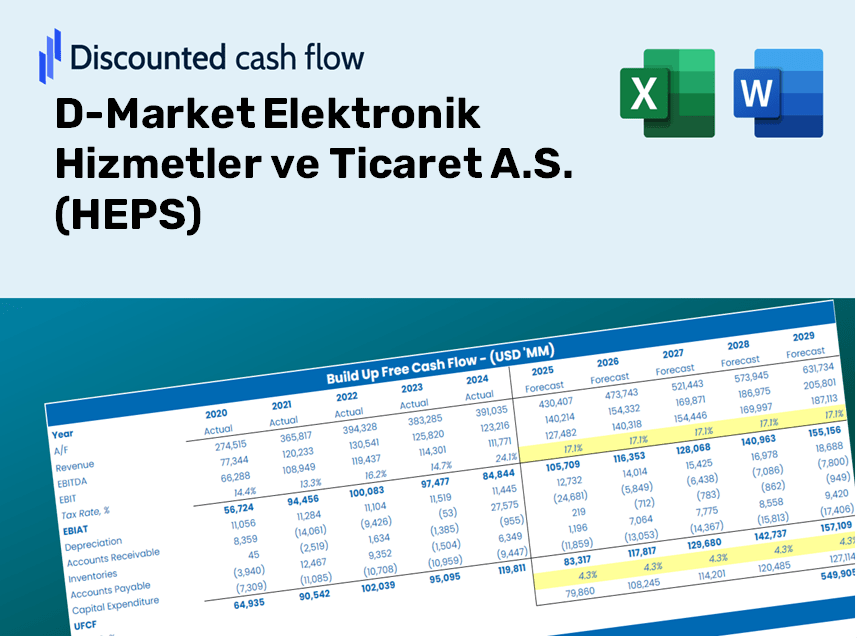
D-Market Elektronik Hizmetler Ve Ticaret A.S. (HEPS) DCF -Bewertung |
Fully Editable: Tailor To Your Needs In Excel Or Sheets
Professional Design: Trusted, Industry-Standard Templates
Investor-Approved Valuation Models
MAC/PC Compatible, Fully Unlocked
No Expertise Is Needed; Easy To Follow
D-Market Elektronik Hizmetler ve Ticaret A.S. (HEPS) Bundle
Möchten Sie den inneren Wert von D-Market Elektronik Hizmetler Ve Ticaret A.S. bewerten? Unser (HEPS) DCF-Taschenrechner integriert reale Daten mit umfassenden Anpassungsfunktionen, sodass Sie Prognosen anpassen und Ihre Anlagestrategien verbessern können.
Discounted Cash Flow (DCF) - (USD MM)
| Year | AY1 2020 |
AY2 2021 |
AY3 2022 |
AY4 2023 |
AY5 2024 |
FY1 2025 |
FY2 2026 |
FY3 2027 |
FY4 2028 |
FY5 2029 |
|---|---|---|---|---|---|---|---|---|---|---|
| Revenue | 152.9 | 181.2 | 385.4 | 852.7 | 1,368.0 | 2,322.2 | 3,941.7 | 6,690.8 | 11,357.2 | 19,278.0 |
| Revenue Growth, % | 0 | 18.54 | 112.61 | 121.28 | 60.43 | 69.74 | 69.74 | 69.74 | 69.74 | 69.74 |
| EBITDA | -7.1 | -50.7 | -81.2 | 63.0 | 79.4 | -188.0 | -319.1 | -541.6 | -919.4 | -1,560.6 |
| EBITDA, % | -4.63 | -27.97 | -21.07 | 7.39 | 5.8 | -8.1 | -8.1 | -8.1 | -8.1 | -8.1 |
| Depreciation | 7.2 | 15.3 | 20.3 | 28.2 | 49.1 | 117.5 | 199.5 | 338.7 | 574.9 | 975.8 |
| Depreciation, % | 4.73 | 8.43 | 5.26 | 3.3 | 3.59 | 5.06 | 5.06 | 5.06 | 5.06 | 5.06 |
| EBIT | -14.3 | -66.0 | -101.4 | 34.9 | 30.2 | -305.5 | -518.6 | -880.3 | -1,494.3 | -2,536.4 |
| EBIT, % | -9.36 | -36.4 | -26.32 | 4.09 | 2.21 | -13.16 | -13.16 | -13.16 | -13.16 | -13.16 |
| Total Cash | 14.2 | 195.8 | 208.8 | 173.2 | 219.1 | 927.9 | 1,575.1 | 2,673.6 | 4,538.3 | 7,703.4 |
| Total Cash, percent | .0 | .0 | .0 | .0 | .0 | .0 | .0 | .0 | .0 | .0 |
| Account Receivables | 5.1 | 14.1 | 40.4 | 95.1 | 122.7 | 193.8 | 328.9 | 558.3 | 947.7 | 1,608.7 |
| Account Receivables, % | 3.34 | 7.79 | 10.48 | 11.15 | 8.97 | 8.34 | 8.34 | 8.34 | 8.34 | 8.34 |
| Inventories | 18.5 | 69.0 | 70.7 | 95.1 | 143.9 | 418.6 | 710.6 | 1,206.2 | 2,047.5 | 3,475.5 |
| Inventories, % | 12.08 | 38.06 | 18.34 | 11.15 | 10.52 | 18.03 | 18.03 | 18.03 | 18.03 | 18.03 |
| Accounts Payable | 48.6 | 117.7 | 232.6 | 154.2 | 359.1 | 935.3 | 1,587.5 | 2,694.8 | 4,574.2 | 7,764.3 |
| Accounts Payable, % | 31.75 | 64.93 | 60.36 | 18.09 | 26.25 | 40.28 | 40.28 | 40.28 | 40.28 | 40.28 |
| Capital Expenditure | -2.4 | -5.2 | -20.3 | -27.7 | -48.2 | -76.4 | -129.6 | -220.0 | -373.4 | -633.9 |
| Capital Expenditure, % | -1.57 | -2.84 | -5.26 | -3.24 | -3.52 | -3.29 | -3.29 | -3.29 | -3.29 | -3.29 |
| Tax Rate, % | 0 | 0 | 0 | 0 | 0 | 0 | 0 | 0 | 0 | 0 |
| EBITAT | -18.0 | -351.1 | -101.7 | 34.9 | 30.2 | -305.5 | -518.6 | -880.3 | -1,494.3 | -2,536.4 |
| Depreciation | ||||||||||
| Changes in Account Receivables | ||||||||||
| Changes in Inventories | ||||||||||
| Changes in Accounts Payable | ||||||||||
| Capital Expenditure | ||||||||||
| UFCF | 11.8 | -331.4 | -14.7 | -122.1 | 159.6 | -34.0 | -223.5 | -379.4 | -644.1 | -1,093.3 |
| WACC, % | 21.28 | 21.28 | 21.28 | 21.28 | 21.28 | 21.28 | 21.28 | 21.28 | 21.28 | 21.28 |
| PV UFCF | ||||||||||
| SUM PV UFCF | -1,107.2 | |||||||||
| Long Term Growth Rate, % | 2.00 | |||||||||
| Free cash flow (T + 1) | -1,115 | |||||||||
| Terminal Value | -5,785 | |||||||||
| Present Terminal Value | -2,205 | |||||||||
| Enterprise Value | -3,312 | |||||||||
| Net Debt | -108 | |||||||||
| Equity Value | -3,204 | |||||||||
| Diluted Shares Outstanding, MM | 321 | |||||||||
| Equity Value Per Share | -9.98 |
What You Will Receive
- Adjustable Forecast Parameters: Effortlessly modify key assumptions (growth %, profit margins, WACC) to explore various scenarios.
- Industry-Specific Data: D-Market Elektronik Hizmetler ve Ticaret A.S. (HEPS) financial information provided to enhance your analysis.
- Automated DCF Calculations: The model computes Net Present Value (NPV) and intrinsic value automatically.
- Professional and Adaptable: A sleek Excel template designed to meet your valuation requirements.
- Designed for Analysts and Investors: Perfect for testing forecasts, validating approaches, and streamlining your process.
Highlighted Features
- Customizable Forecast Inputs: Adjust essential metrics such as revenue growth, EBITDA margin, and capital investment.
- Instant DCF Valuation: Quickly computes intrinsic value, NPV, and additional financial metrics.
- Industry-Leading Precision: Leverages D-Market's real financial data for accurate valuation results.
- Effortless Scenario Analysis: Easily examine various assumptions and assess the resulting impacts.
- Productivity Enhancement: Avoid the hassle of developing intricate valuation models from the ground up.
How It Functions
- Step 1: Download the Excel spreadsheet.
- Step 2: Examine the pre-filled data for D-Market Elektronik Hizmetler ve Ticaret A.S. (HEPS) (historical and forecasted).
- Step 3: Modify key assumptions (highlighted in yellow) according to your analysis.
- Step 4: Observe the automatic recalculations for D-Market’s intrinsic value.
- Step 5: Utilize the results for investment decisions or reporting purposes.
Why Opt for D-Market [HEPS] Calculator?
- Time-Efficient: Start analyzing immediately without the hassle of building a DCF model from the ground up.
- Enhanced Accuracy: Utilize dependable financial data and formulas to minimize valuation errors.
- Completely Customizable: Adapt the model to align with your specific assumptions and forecasts.
- User-Friendly: Intuitive charts and outputs simplify the analysis of results.
- Preferred by Professionals: Crafted for experts who prioritize precision and ease of use.
Who Can Benefit from D-Market Elektronik Hizmetler ve Ticaret A.S. (HEPS)?
- Finance Students: Master valuation methods and apply them to real-world data.
- Academics: Integrate industry-standard models into your courses or research projects.
- Investors: Validate your investment strategies and evaluate the valuation metrics for D-Market (HEPS).
- Analysts: Enhance your analysis process with a ready-to-use, customizable discounted cash flow model.
- Small Business Owners: Discover how major public companies like D-Market are evaluated in the market.
Contents of the Template
- Pre-Filled DCF Model: D-Market Elektronik Hizmetler ve Ticaret A.S. (HEPS) financial data ready for immediate analysis.
- WACC Calculator: Comprehensive calculations for the Weighted Average Cost of Capital.
- Financial Ratios: Assess D-Market's profitability, leverage, and operational efficiency.
- Editable Inputs: Modify assumptions such as growth rates, margins, and capital expenditures to suit your needs.
- Financial Statements: Access to annual and quarterly reports for in-depth evaluation.
- Interactive Dashboard: Effortlessly visualize essential valuation metrics and outcomes.
Disclaimer
All information, articles, and product details provided on this website are for general informational and educational purposes only. We do not claim any ownership over, nor do we intend to infringe upon, any trademarks, copyrights, logos, brand names, or other intellectual property mentioned or depicted on this site. Such intellectual property remains the property of its respective owners, and any references here are made solely for identification or informational purposes, without implying any affiliation, endorsement, or partnership.
We make no representations or warranties, express or implied, regarding the accuracy, completeness, or suitability of any content or products presented. Nothing on this website should be construed as legal, tax, investment, financial, medical, or other professional advice. In addition, no part of this site—including articles or product references—constitutes a solicitation, recommendation, endorsement, advertisement, or offer to buy or sell any securities, franchises, or other financial instruments, particularly in jurisdictions where such activity would be unlawful.
All content is of a general nature and may not address the specific circumstances of any individual or entity. It is not a substitute for professional advice or services. Any actions you take based on the information provided here are strictly at your own risk. You accept full responsibility for any decisions or outcomes arising from your use of this website and agree to release us from any liability in connection with your use of, or reliance upon, the content or products found herein.