
|
Hargreaves Lansdown Plc (HL.L) DCF -Bewertung |
Fully Editable: Tailor To Your Needs In Excel Or Sheets
Professional Design: Trusted, Industry-Standard Templates
Investor-Approved Valuation Models
MAC/PC Compatible, Fully Unlocked
No Expertise Is Needed; Easy To Follow
Hargreaves Lansdown plc (HL.L) Bundle
Stürzen Sie Ihre Analyse und verbessern Sie die Präzision mit unserem (HLL) DCF -Taschenrechner! Mithilfe der aktuellen Hargreaves Lansdown Plc-Daten und anpassbaren Annahmen ermöglichen dieses Tool Sie wie ein erfahrener Investor prognostizieren, analysieren und value (HLL).
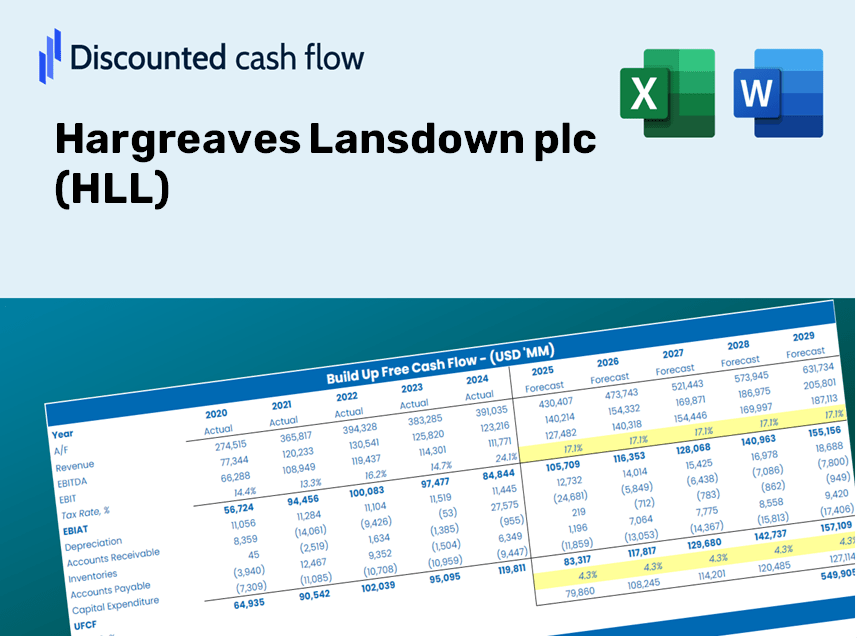
Discounted Cash Flow (DCF) - (USD MM)
| Year | AY1 2019 |
AY2 2020 |
AY3 2021 |
AY4 2022 |
AY5 2023 |
FY1 2024 |
FY2 2025 |
FY3 2026 |
FY4 2027 |
FY5 2028 |
|---|---|---|---|---|---|---|---|---|---|---|
| Revenue | 550.9 | 631.0 | 583.0 | 735.1 | 764.9 | 835.8 | 913.3 | 997.9 | 1,090.4 | 1,191.5 |
| Revenue Growth, % | 0 | 14.54 | -7.61 | 26.09 | 4.05 | 9.27 | 9.27 | 9.27 | 9.27 | 9.27 |
| EBITDA | 351.3 | 381.8 | 286.1 | 399.7 | 411.2 | 470.5 | 514.1 | 561.8 | 613.9 | 670.8 |
| EBITDA, % | 63.77 | 60.51 | 49.07 | 54.37 | 53.76 | 56.3 | 56.3 | 56.3 | 56.3 | 56.3 |
| Depreciation | 13.6 | 15.1 | 15.1 | 15.3 | 14.6 | 19.1 | 20.9 | 22.8 | 25.0 | 27.3 |
| Depreciation, % | 2.47 | 2.39 | 2.59 | 2.08 | 1.91 | 2.29 | 2.29 | 2.29 | 2.29 | 2.29 |
| EBIT | 337.7 | 366.7 | 271.0 | 384.4 | 396.6 | 451.4 | 493.2 | 539.0 | 588.9 | 643.5 |
| EBIT, % | 61.3 | 58.11 | 46.48 | 52.29 | 51.85 | 54.01 | 54.01 | 54.01 | 54.01 | 54.01 |
| Total Cash | 463.4 | 504.4 | 508.8 | 498.5 | 637.5 | 672.8 | 735.2 | 803.3 | 877.8 | 959.1 |
| Total Cash, percent | .0 | .0 | .0 | .0 | .0 | .0 | .0 | .0 | .0 | .0 |
| Account Receivables | 728.4 | 791.2 | 481.6 | 679.3 | 777.7 | 794.0 | 867.6 | 948.1 | 1,035.9 | 1,132.0 |
| Account Receivables, % | 132.22 | 125.39 | 82.61 | 92.41 | 101.67 | 95 | 95 | 95 | 95 | 95 |
| Inventories | -.6 | -.9 | -.8 | -.5 | .0 | -.8 | -.8 | -.9 | -1.0 | -1.1 |
| Inventories, % | -0.10891 | -0.14263 | -0.13722 | -0.06801782 | 0 | -0.0913565 | -0.0913565 | -0.0913565 | -0.0913565 | -0.0913565 |
| Accounts Payable | 637.1 | 712.5 | 406.7 | 487.4 | 597.7 | 692.4 | 756.6 | 826.7 | 903.3 | 987.0 |
| Accounts Payable, % | 115.65 | 112.92 | 69.76 | 66.3 | 78.14 | 82.84 | 82.84 | 82.84 | 82.84 | 82.84 |
| Capital Expenditure | -15.9 | -18.2 | -13.7 | -22.7 | -13.0 | -21.6 | -23.6 | -25.8 | -28.2 | -30.8 |
| Capital Expenditure, % | -2.89 | -2.88 | -2.35 | -3.09 | -1.7 | -2.58 | -2.58 | -2.58 | -2.58 | -2.58 |
| Tax Rate, % | 26.02 | 26.02 | 26.02 | 26.02 | 26.02 | 26.02 | 26.02 | 26.02 | 26.02 | 26.02 |
| EBITAT | 279.5 | 297.3 | 217.7 | 309.1 | 293.4 | 359.8 | 393.2 | 429.6 | 469.4 | 513.0 |
| Depreciation | ||||||||||
| Changes in Account Receivables | ||||||||||
| Changes in Inventories | ||||||||||
| Changes in Accounts Payable | ||||||||||
| Capital Expenditure | ||||||||||
| UFCF | 186.5 | 307.1 | 222.8 | 184.4 | 306.4 | 436.5 | 381.2 | 416.5 | 455.1 | 497.3 |
| WACC, % | 7.01 | 7.01 | 7.01 | 7.01 | 7.01 | 7.01 | 7.01 | 7.01 | 7.01 | 7.01 |
| PV UFCF | ||||||||||
| SUM PV UFCF | 1,782.3 | |||||||||
| Long Term Growth Rate, % | 2.00 | |||||||||
| Free cash flow (T + 1) | 507 | |||||||||
| Terminal Value | 10,133 | |||||||||
| Present Terminal Value | 7,223 | |||||||||
| Enterprise Value | 9,005 | |||||||||
| Net Debt | -608 | |||||||||
| Equity Value | 9,613 | |||||||||
| Diluted Shares Outstanding, MM | 475 | |||||||||
| Equity Value Per Share | 2,022.73 |
What You Will Receive
- Authentic HLL Financial Data: Access comprehensive historical and projected information for precise valuation.
- Customizable Parameters: Adjust WACC, tax rates, revenue growth, and capital expenditures to fit your analysis.
- Instant Calculations: Intrinsic value and NPV are computed in real-time.
- Scenario Evaluation: Explore various scenarios to assess Hargreaves Lansdown’s future performance.
- User-Friendly Design: Crafted for professionals, yet easy to navigate for newcomers.
Key Features
- Comprehensive Data Sets: Hargreaves Lansdown's historical financial reports and pre-populated projections.
- Customizable Parameters: Adjust WACC, tax rates, revenue growth, and EBITDA margins to fit your analysis.
- Real-Time Calculations: Monitor the intrinsic value of Hargreaves Lansdown (HLL) as it updates instantly.
- Enhanced Visualizations: Interactive dashboard charts present valuation outcomes and key performance indicators.
- Designed for Precision: A specialized tool tailored for analysts, investors, and finance professionals.
How It Works
- Step 1: Download the Excel file.
- Step 2: Review Hargreaves Lansdown's pre-filled financial data and forecasts.
- Step 3: Adjust key inputs such as revenue growth, WACC, and tax rates (highlighted cells).
- Step 4: Observe the DCF model refresh in real-time as you modify assumptions.
- Step 5: Evaluate the outputs and leverage the results for investment decisions.
Why Opt for This Calculator?
- Reliable Data: Utilize actual Hargreaves Lansdown plc (HLL) financials for trustworthy valuation outcomes.
- Tailored Settings: Modify critical parameters such as growth rates, WACC, and tax rates to align with your forecasts.
- Efficiency Boost: Pre-configured calculations save you the hassle of starting from the ground up.
- Professional-Quality Tool: Created specifically for use by investors, analysts, and consultants.
- User-Friendly Interface: Clear layout and guided instructions ensure accessibility for users of all levels.
Who Can Benefit from Hargreaves Lansdown plc (HLL)?
- Finance Students: Master investment strategies and apply real-world data for a hands-on learning experience.
- Academics: Integrate sophisticated financial models into your teaching or research initiatives.
- Investors: Validate your investment hypotheses and evaluate the performance metrics of Hargreaves Lansdown plc (HLL).
- Analysts: Enhance your productivity with a user-friendly, adaptable financial model tailored for Hargreaves Lansdown plc (HLL).
- Small Business Owners: Discover how major investment firms like Hargreaves Lansdown plc (HLL) assess market opportunities and risks.
Contents of the Template
- Preloaded HLL Data: Historical and projected financial metrics, including revenue, EBIT, and capital expenditures.
- DCF and WACC Models: Professional-grade spreadsheets for calculating intrinsic value and Weighted Average Cost of Capital.
- Editable Inputs: Yellow-highlighted cells for customizing revenue growth, tax rates, and discount rates.
- Financial Statements: Detailed annual and quarterly financials for in-depth analysis.
- Key Ratios: Metrics on profitability, leverage, and efficiency to assess performance.
- Dashboard and Charts: Visual representations of valuation results and underlying assumptions.
Disclaimer
All information, articles, and product details provided on this website are for general informational and educational purposes only. We do not claim any ownership over, nor do we intend to infringe upon, any trademarks, copyrights, logos, brand names, or other intellectual property mentioned or depicted on this site. Such intellectual property remains the property of its respective owners, and any references here are made solely for identification or informational purposes, without implying any affiliation, endorsement, or partnership.
We make no representations or warranties, express or implied, regarding the accuracy, completeness, or suitability of any content or products presented. Nothing on this website should be construed as legal, tax, investment, financial, medical, or other professional advice. In addition, no part of this site—including articles or product references—constitutes a solicitation, recommendation, endorsement, advertisement, or offer to buy or sell any securities, franchises, or other financial instruments, particularly in jurisdictions where such activity would be unlawful.
All content is of a general nature and may not address the specific circumstances of any individual or entity. It is not a substitute for professional advice or services. Any actions you take based on the information provided here are strictly at your own risk. You accept full responsibility for any decisions or outcomes arising from your use of this website and agree to release us from any liability in connection with your use of, or reliance upon, the content or products found herein.