
|
Haleon plc (hln.l) DCF -Bewertung |
Fully Editable: Tailor To Your Needs In Excel Or Sheets
Professional Design: Trusted, Industry-Standard Templates
Investor-Approved Valuation Models
MAC/PC Compatible, Fully Unlocked
No Expertise Is Needed; Easy To Follow
Haleon plc (HLN.L) Bundle
Entdecken Sie das wahre Potenzial von Haleon Plc (HLNL) mit unserem Premium -DCF -Taschenrechner! Passen Sie die wichtigsten Annahmen an, erkunden Sie verschiedene Szenarien und untersuchen, wie sich Änderungen auf die Bewertung der Haleon PLC (HLNL) auswirken - alles innerhalb einer umfassenden Excel -Vorlage.
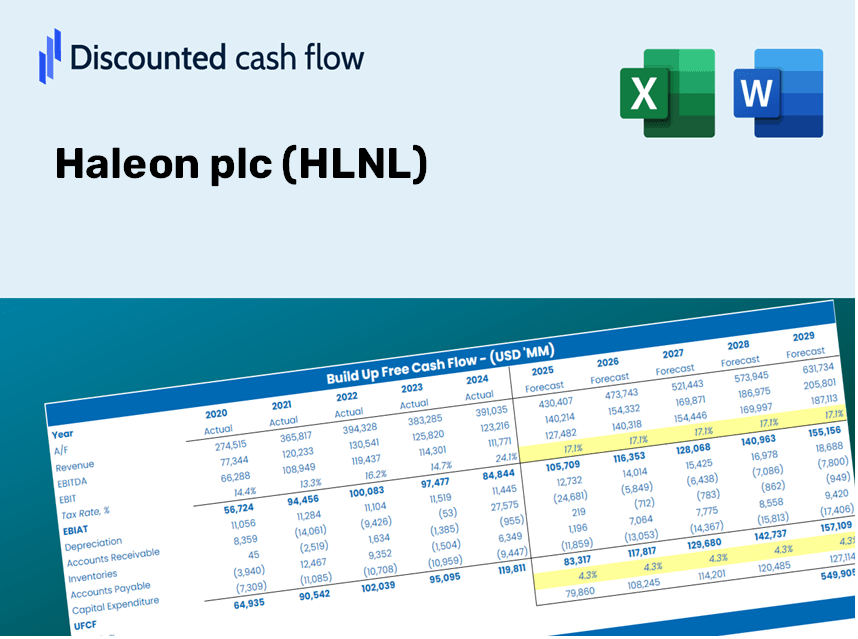
Discounted Cash Flow (DCF) - (USD MM)
| Year | AY1 2020 |
AY2 2021 |
AY3 2022 |
AY4 2023 |
AY5 2024 |
FY1 2025 |
FY2 2026 |
FY3 2027 |
FY4 2028 |
FY5 2029 |
|---|---|---|---|---|---|---|---|---|---|---|
| Revenue | 9,892.0 | 9,545.0 | 10,858.0 | 11,302.0 | 11,233.0 | 11,618.5 | 12,017.2 | 12,429.6 | 12,856.1 | 13,297.3 |
| Revenue Growth, % | 0 | -3.51 | 13.76 | 4.09 | -0.61051 | 3.43 | 3.43 | 3.43 | 3.43 | 3.43 |
| EBITDA | 2,190.0 | 2,211.0 | 2,683.0 | 2,674.0 | 2,683.0 | 2,731.7 | 2,825.4 | 2,922.4 | 3,022.7 | 3,126.4 |
| EBITDA, % | 22.14 | 23.16 | 24.71 | 23.66 | 23.88 | 23.51 | 23.51 | 23.51 | 23.51 | 23.51 |
| Depreciation | 217.0 | 268.0 | 287.0 | 191.0 | 196.0 | 257.5 | 266.3 | 275.4 | 284.9 | 294.7 |
| Depreciation, % | 2.19 | 2.81 | 2.64 | 1.69 | 1.74 | 2.22 | 2.22 | 2.22 | 2.22 | 2.22 |
| EBIT | 1,973.0 | 1,943.0 | 2,396.0 | 2,483.0 | 2,487.0 | 2,474.2 | 2,559.1 | 2,647.0 | 2,737.8 | 2,831.7 |
| EBIT, % | 19.95 | 20.36 | 22.07 | 21.97 | 22.14 | 21.3 | 21.3 | 21.3 | 21.3 | 21.3 |
| Total Cash | 334.0 | 414.0 | 684.0 | 1,044.0 | 2,195.0 | 994.3 | 1,028.5 | 1,063.8 | 1,100.3 | 1,138.0 |
| Total Cash, percent | .0 | .0 | .0 | .0 | .0 | .0 | .0 | .0 | .0 | .0 |
| Account Receivables | 3,651.0 | 3,881.0 | 1,881.0 | 1,352.0 | 1,904.0 | 2,876.8 | 2,975.6 | 3,077.7 | 3,183.3 | 3,292.5 |
| Account Receivables, % | 36.91 | 40.66 | 17.32 | 11.96 | 16.95 | 24.76 | 24.76 | 24.76 | 24.76 | 24.76 |
| Inventories | 949.0 | 951.0 | 1,348.0 | 1,408.0 | 1,190.0 | 1,278.6 | 1,322.5 | 1,367.8 | 1,414.8 | 1,463.3 |
| Inventories, % | 9.59 | 9.96 | 12.41 | 12.46 | 10.59 | 11 | 11 | 11 | 11 | 11 |
| Accounts Payable | 1,340.0 | 1,369.0 | 1,835.0 | 1,855.0 | 1,973.0 | 1,830.3 | 1,893.1 | 1,958.1 | 2,025.3 | 2,094.8 |
| Accounts Payable, % | 13.55 | 14.34 | 16.9 | 16.41 | 17.56 | 15.75 | 15.75 | 15.75 | 15.75 | 15.75 |
| Capital Expenditure | -318.0 | -298.0 | -328.0 | -336.0 | -318.0 | -352.3 | -364.4 | -376.9 | -389.8 | -403.2 |
| Capital Expenditure, % | -3.21 | -3.12 | -3.02 | -2.97 | -2.83 | -3.03 | -3.03 | -3.03 | -3.03 | -3.03 |
| Tax Rate, % | 24.5 | 24.5 | 24.5 | 24.5 | 24.5 | 24.5 | 24.5 | 24.5 | 24.5 | 24.5 |
| EBITAT | 1,419.9 | 1,650.8 | 1,569.7 | 1,599.9 | 1,877.6 | 1,793.2 | 1,854.7 | 1,918.4 | 1,984.2 | 2,052.3 |
| Depreciation | ||||||||||
| Changes in Account Receivables | ||||||||||
| Changes in Inventories | ||||||||||
| Changes in Accounts Payable | ||||||||||
| Capital Expenditure | ||||||||||
| UFCF | -1,941.1 | 1,417.8 | 3,597.7 | 1,943.9 | 1,539.6 | 494.2 | 1,676.8 | 1,734.4 | 1,793.9 | 1,855.5 |
| WACC, % | 4.34 | 4.46 | 4.28 | 4.27 | 4.37 | 4.34 | 4.34 | 4.34 | 4.34 | 4.34 |
| PV UFCF | ||||||||||
| SUM PV UFCF | 6,554.2 | |||||||||
| Long Term Growth Rate, % | 3.00 | |||||||||
| Free cash flow (T + 1) | 1,911 | |||||||||
| Terminal Value | 142,407 | |||||||||
| Present Terminal Value | 115,142 | |||||||||
| Enterprise Value | 121,697 | |||||||||
| Net Debt | 7,907 | |||||||||
| Equity Value | 113,790 | |||||||||
| Diluted Shares Outstanding, MM | 9,175 | |||||||||
| Equity Value Per Share | 1,240.21 |
What You Will Receive
- Authentic Haleon Data: Comprehensive financials – spanning revenue to EBIT – derived from real and projected figures.
- Complete Customization: Modify all essential parameters (yellow cells) such as WACC, growth %, and tax rates.
- Instant Valuation Updates: Automatic recalculations to assess how changes affect the fair value of Haleon plc (HLNL).
- Flexible Excel Template: Designed for quick adjustments, scenario analysis, and in-depth forecasting.
- Efficient and Precise: Avoid the hassle of creating models from the ground up while ensuring accuracy and adaptability.
Key Features
- Comprehensive DCF Calculator: Offers in-depth unlevered and levered DCF valuation models tailored for Haleon plc (HLNL).
- WACC Calculator: Includes a pre-configured Weighted Average Cost of Capital sheet with adjustable parameters.
- Customizable Forecast Assumptions: Easily alter growth projections, capital expenditures, and discount rates.
- Integrated Financial Ratios: Evaluate profitability, leverage, and efficiency ratios specific to Haleon plc (HLNL).
- Interactive Dashboard and Charts: Visual representations provide a clear overview of essential valuation metrics for straightforward analysis.
How It Functions
- Download: Obtain the pre-prepared Excel file containing Haleon plc’s (HLNL) financial data.
- Customize: Tailor your forecasts by modifying revenue growth, EBITDA percentage, and WACC.
- Update Automatically: Enjoy real-time updates on intrinsic value and NPV calculations.
- Test Scenarios: Generate various projections and quickly compare results.
- Make Decisions: Utilize the valuation outcomes to inform your investment strategy.
Why Choose the Haleon Calculator?
- User-Friendly Interface: Perfectly crafted for both novice users and seasoned professionals.
- Customizable Inputs: Adjust the parameters easily to suit your specific analysis needs.
- Real-Time Valuation: Instantly view changes in Haleon’s valuation as you tweak the inputs.
- Pre-Loaded Data: Comes ready with Haleon’s actual financial information for fast and efficient analysis.
- Preferred by Experts: Widely used by investors and financial analysts for making well-informed decisions.
Who Can Benefit from Haleon plc (HLNL)?
- Investors: Make informed choices with a premier valuation tool tailored for your needs.
- Financial Analysts: Streamline your workflow with a customizable, pre-designed DCF model.
- Consultants: Effortlessly modify the template for presentations or client reports.
- Finance Enthusiasts: Enhance your knowledge of valuation techniques through practical, real-world examples.
- Educators and Students: Utilize this resource as a hands-on learning aid in finance courses.
Contents of the Template
- Pre-Filled Data: Contains Haleon plc's historical financial figures and projections.
- Discounted Cash Flow Model: An editable DCF valuation model featuring automated calculations.
- Weighted Average Cost of Capital (WACC): A dedicated worksheet for WACC computation based on user-defined inputs.
- Key Financial Ratios: Evaluate Haleon plc's profitability, efficiency, and capital structure.
- Customizable Inputs: Easily modify revenue growth rates, profit margins, and tax percentages.
- Clear Dashboard: Visuals and tables that summarize essential valuation outcomes.
Disclaimer
All information, articles, and product details provided on this website are for general informational and educational purposes only. We do not claim any ownership over, nor do we intend to infringe upon, any trademarks, copyrights, logos, brand names, or other intellectual property mentioned or depicted on this site. Such intellectual property remains the property of its respective owners, and any references here are made solely for identification or informational purposes, without implying any affiliation, endorsement, or partnership.
We make no representations or warranties, express or implied, regarding the accuracy, completeness, or suitability of any content or products presented. Nothing on this website should be construed as legal, tax, investment, financial, medical, or other professional advice. In addition, no part of this site—including articles or product references—constitutes a solicitation, recommendation, endorsement, advertisement, or offer to buy or sell any securities, franchises, or other financial instruments, particularly in jurisdictions where such activity would be unlawful.
All content is of a general nature and may not address the specific circumstances of any individual or entity. It is not a substitute for professional advice or services. Any actions you take based on the information provided here are strictly at your own risk. You accept full responsibility for any decisions or outcomes arising from your use of this website and agree to release us from any liability in connection with your use of, or reliance upon, the content or products found herein.