
|
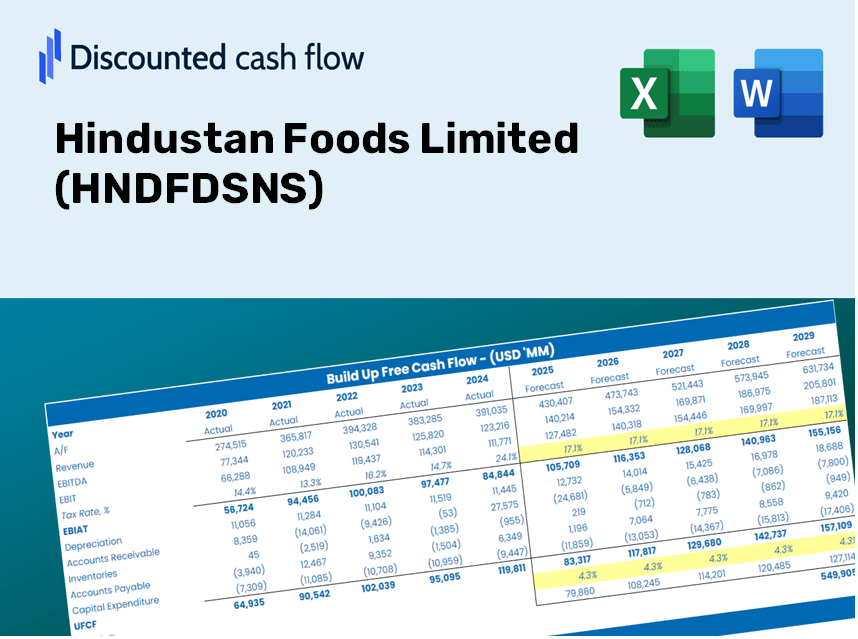
Hindustan Foods Limited (HNDFDS.NS) DCF -Bewertung |
Fully Editable: Tailor To Your Needs In Excel Or Sheets
Professional Design: Trusted, Industry-Standard Templates
Investor-Approved Valuation Models
MAC/PC Compatible, Fully Unlocked
No Expertise Is Needed; Easy To Follow
Hindustan Foods Limited (HNDFDS.NS) Bundle
Vereinfachen Sie die Bewertung von Hindustan Foods Limited (HNDFDSNS) mit diesem anpassbaren DCF -Taschenrechner! Mit echten Hindustan Foods Limited (HNDFDSNS) -Fonds und einstellbaren Prognoseeingaben können Sie Szenarien testen und Hindustan Foods Limited (HNDFDSNS) in Minuten aufdecken.
What You Will Receive
- Authentic Hindustan Foods Data: Preloaded financial metrics – encompassing revenue to EBIT – based on real and forecasted figures.
- Comprehensive Customization: Modify all essential parameters (yellow cells) such as WACC, growth %, and tax rates.
- Immediate Valuation Updates: Automatic recalculations to assess the effects of changes on Hindustan Foods' fair value.
- Flexible Excel Template: Designed for quick amendments, scenario analysis, and detailed forecasting.
- Efficient and Precise: Avoid the hassle of building models from the ground up while ensuring accuracy and adaptability.
Key Features
- 🔍 Real-Life HNDFDSNS Financials: Pre-filled historical and projected data for Hindustan Foods Limited.
- ✏️ Fully Customizable Inputs: Modify all essential parameters (yellow cells) such as WACC, growth %, and tax rates.
- 📊 Professional DCF Valuation: Integrated formulas determine Hindustan Foods’ intrinsic value using the Discounted Cash Flow method.
- ⚡ Instant Results: Visualize Hindustan Foods’ valuation immediately after making any adjustments.
- Scenario Analysis: Evaluate and compare results for different financial assumptions side-by-side.
How It Operates
- Step 1: Download the prebuilt Excel template featuring Hindustan Foods Limited’s (HNDFDSNS) data.
- Step 2: Navigate through the pre-filled sheets to familiarize yourself with the essential metrics.
- Step 3: Modify forecasts and assumptions in the editable yellow cells (WACC, growth, margins).
- Step 4: Instantly observe updated results, including the intrinsic value of Hindustan Foods Limited (HNDFDSNS).
- Step 5: Utilize the outputs to make informed investment decisions or create detailed reports.
Why Opt for This Calculator?
- All-in-One Solution: Features DCF, WACC, and financial ratio assessments within a single interface.
- Flexible Inputs: Modify the yellow-highlighted fields to explore various scenarios.
- In-Depth Analysis: Automatically computes the intrinsic value and Net Present Value for Hindustan Foods Limited (HNDFDSNS).
- Data-Ready: Comes with historical and projected data for precise initial calculations.
- Expert-Level Quality: Perfect for financial analysts, investors, and business consultants.
Who Can Benefit from This Product?
- Institutional Investors: Create comprehensive and dependable valuation models to assess their portfolios.
- Corporate Finance Departments: Evaluate various valuation scenarios to inform strategic decisions within the company.
- Financial Consultants: Deliver precise valuation insights for Hindustan Foods Limited (HNDFDSNS) to clients.
- Academics and Students: Utilize real market data to enhance learning and skill development in financial modeling.
- Market Analysts: Gain insights into how companies like Hindustan Foods Limited (HNDFDSNS) are valued within the industry.
Contents of the Template
- Pre-Filled Data: Contains Hindustan Foods Limited's historical financials and projections.
- Discounted Cash Flow Model: An editable DCF valuation model with automatic calculations included.
- Weighted Average Cost of Capital (WACC): A separate sheet for calculating WACC based on your custom inputs.
- Key Financial Ratios: Evaluate Hindustan Foods Limited's profitability, efficiency, and leverage metrics.
- Customizable Inputs: Easily modify revenue growth, profit margins, and tax rates.
- Clear Dashboard: Visuals and tables that summarize the key valuation outcomes.
Disclaimer
All information, articles, and product details provided on this website are for general informational and educational purposes only. We do not claim any ownership over, nor do we intend to infringe upon, any trademarks, copyrights, logos, brand names, or other intellectual property mentioned or depicted on this site. Such intellectual property remains the property of its respective owners, and any references here are made solely for identification or informational purposes, without implying any affiliation, endorsement, or partnership.
We make no representations or warranties, express or implied, regarding the accuracy, completeness, or suitability of any content or products presented. Nothing on this website should be construed as legal, tax, investment, financial, medical, or other professional advice. In addition, no part of this site—including articles or product references—constitutes a solicitation, recommendation, endorsement, advertisement, or offer to buy or sell any securities, franchises, or other financial instruments, particularly in jurisdictions where such activity would be unlawful.
All content is of a general nature and may not address the specific circumstances of any individual or entity. It is not a substitute for professional advice or services. Any actions you take based on the information provided here are strictly at your own risk. You accept full responsibility for any decisions or outcomes arising from your use of this website and agree to release us from any liability in connection with your use of, or reliance upon, the content or products found herein.