
|
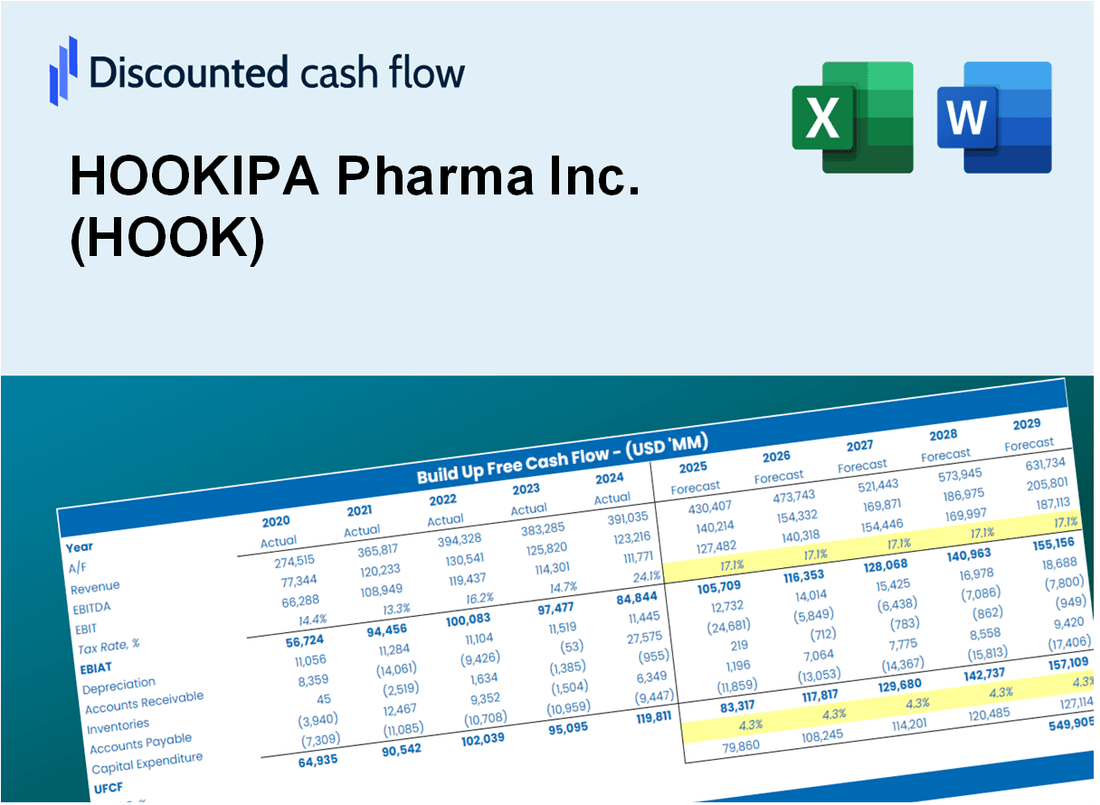
Hookipa Pharma Inc. (Hook) DCF -Bewertung |
Fully Editable: Tailor To Your Needs In Excel Or Sheets
Professional Design: Trusted, Industry-Standard Templates
Investor-Approved Valuation Models
MAC/PC Compatible, Fully Unlocked
No Expertise Is Needed; Easy To Follow
HOOKIPA Pharma Inc. (HOOK) Bundle
Möchten Sie den inneren Wert von Hookipa Pharma Inc. bewerten? Unser Hook DCF-Taschenrechner integriert reale Daten mit umfangreichen Anpassungsfunktionen, sodass Sie Ihre Prognosen verfeinern und Ihre Anlagestrategien verbessern können.
Discounted Cash Flow (DCF) - (USD MM)
| Year | AY1 2020 |
AY2 2021 |
AY3 2022 |
AY4 2023 |
AY5 2024 |
FY1 2025 |
FY2 2026 |
FY3 2027 |
FY4 2028 |
FY5 2029 |
|---|---|---|---|---|---|---|---|---|---|---|
| Revenue | 19.6 | 18.4 | 14.2 | 20.1 | 43.9 | 56.3 | 72.2 | 92.5 | 118.6 | 152.0 |
| Revenue Growth, % | 0 | -5.8 | -22.76 | 41.27 | 118.32 | 28.18 | 28.18 | 28.18 | 28.18 | 28.18 |
| EBITDA | -39.1 | -70.1 | -60.4 | -77.3 | -40.9 | -55.5 | -71.2 | -91.2 | -116.9 | -149.9 |
| EBITDA, % | -199.89 | -380.13 | -423.86 | -384.24 | -92.96 | -98.59 | -98.59 | -98.59 | -98.59 | -98.59 |
| Depreciation | 4.2 | 4.6 | 3.6 | 3.6 | 2.8 | 10.8 | 13.8 | 17.7 | 22.7 | 29.0 |
| Depreciation, % | 21.19 | 25.15 | 25.28 | 17.65 | 6.26 | 19.11 | 19.11 | 19.11 | 19.11 | 19.11 |
| EBIT | -43.3 | -74.8 | -64.0 | -80.9 | -43.6 | -56.2 | -72.1 | -92.4 | -118.4 | -151.8 |
| EBIT, % | -221.08 | -405.28 | -449.14 | -401.88 | -99.23 | -99.85 | -99.85 | -99.85 | -99.85 | -99.85 |
| Total Cash | 143.2 | 65.9 | 113.4 | 117.1 | 39.7 | 55.2 | 70.8 | 90.7 | 116.3 | 149.1 |
| Total Cash, percent | .0 | .0 | .0 | .0 | .0 | .0 | .0 | .0 | .0 | .0 |
| Account Receivables | 20.7 | 21.2 | 22.0 | 19.3 | 23.7 | 50.7 | 64.9 | 83.2 | 106.7 | 136.7 |
| Account Receivables, % | 105.48 | 114.73 | 154.48 | 95.74 | 53.86 | 89.92 | 89.92 | 89.92 | 89.92 | 89.92 |
| Inventories | -.4 | -14.3 | -.4 | .0 | .0 | -9.3 | -11.9 | -15.3 | -19.6 | -25.1 |
| Inventories, % | -2.22 | -77.36 | -2.94 | 0 | 0 | -16.5 | -16.5 | -16.5 | -16.5 | -16.5 |
| Accounts Payable | 8.0 | 8.8 | 5.5 | 12.5 | 8.7 | 23.5 | 30.1 | 38.6 | 49.5 | 63.5 |
| Accounts Payable, % | 40.9 | 47.5 | 38.51 | 62.09 | 19.77 | 41.75 | 41.75 | 41.75 | 41.75 | 41.75 |
| Capital Expenditure | -2.4 | -12.6 | -5.0 | -4.2 | -.2 | -15.4 | -19.7 | -25.3 | -32.4 | -41.5 |
| Capital Expenditure, % | -12.11 | -68.2 | -35.21 | -20.66 | -0.44145 | -27.32 | -27.32 | -27.32 | -27.32 | -27.32 |
| Tax Rate, % | 0.24307 | 0.24307 | 0.24307 | 0.24307 | 0.24307 | 0.24307 | 0.24307 | 0.24307 | 0.24307 | 0.24307 |
| EBITAT | -43.3 | -74.8 | -64.0 | -81.3 | -43.5 | -56.2 | -72.1 | -92.4 | -118.4 | -151.7 |
| Depreciation | ||||||||||
| Changes in Account Receivables | ||||||||||
| Changes in Inventories | ||||||||||
| Changes in Accounts Payable | ||||||||||
| Capital Expenditure | ||||||||||
| UFCF | -53.7 | -68.6 | -83.4 | -72.5 | -49.2 | -63.7 | -83.0 | -106.4 | -136.4 | -174.8 |
| WACC, % | 8.24 | 8.24 | 8.24 | 8.24 | 8.24 | 8.24 | 8.24 | 8.24 | 8.24 | 8.24 |
| PV UFCF | ||||||||||
| SUM PV UFCF | -430.6 | |||||||||
| Long Term Growth Rate, % | 2.00 | |||||||||
| Free cash flow (T + 1) | -178 | |||||||||
| Terminal Value | -2,856 | |||||||||
| Present Terminal Value | -1,922 | |||||||||
| Enterprise Value | -2,353 | |||||||||
| Net Debt | -39 | |||||||||
| Equity Value | -2,314 | |||||||||
| Diluted Shares Outstanding, MM | 13 | |||||||||
| Equity Value Per Share | -184.53 |
What You Will Receive
- Comprehensive Financial Model: HOOKIPA Pharma Inc.’s actual data facilitates accurate DCF valuation.
- Complete Forecast Control: Modify revenue growth, profit margins, WACC, and other essential factors.
- Real-Time Calculations: Automatic updates provide immediate feedback as adjustments are made.
- Professional-Grade Template: A polished Excel file crafted for high-quality valuation presentations.
- Flexible and Reusable: Designed for adaptability, allowing for repeated applications in detailed forecasting.
Key Features
- Customizable Clinical Parameters: Adjust essential inputs such as trial success rates, market penetration, and R&D expenditures.
- Instant Valuation Calculations: Provides real-time insights into intrinsic value, NPV, and other financial metrics.
- High-Precision Analytics: Leverages HOOKIPA Pharma's actual financial data for credible valuation results.
- Effortless Scenario Testing: Easily evaluate various hypotheses and analyze their impacts side by side.
- Efficiency Booster: Streamlines the valuation process, removing the necessity for complex model construction.
How It Works
- Step 1: Download the prebuilt Excel template containing HOOKIPA Pharma Inc.'s (HOOK) data.
- Step 2: Navigate through the pre-filled sheets to familiarize yourself with the essential metrics.
- Step 3: Modify forecasts and assumptions in the editable yellow cells (WACC, growth, margins).
- Step 4: Instantly see the recalculated results, including HOOKIPA Pharma Inc.'s (HOOK) intrinsic value.
- Step 5: Make well-informed investment choices or create reports based on the outputs.
Why Choose This Calculator for HOOKIPA Pharma Inc. (HOOK)?
- Accurate Data: Utilize real HOOKIPA Pharma financials for trustworthy valuation outcomes.
- Customizable: Modify essential parameters such as growth rates, WACC, and tax rates to align with your forecasts.
- Time-Saving: Pre-configured calculations remove the hassle of starting from the ground up.
- Professional-Grade Tool: Tailored for investors, analysts, and consultants in the biotech sector.
- User-Friendly: Easy-to-navigate design and clear instructions ensure accessibility for all users.
Who Should Use HOOKIPA Pharma Inc. (HOOK)?
- Individual Investors: Gain insights to make informed decisions about investing in HOOKIPA Pharma Inc. stock.
- Financial Analysts: Enhance valuation methodologies with comprehensive financial models tailored for HOOK.
- Consultants: Provide clients with accurate and timely valuation analyses of HOOKIPA Pharma Inc.
- Business Owners: Learn how biotech companies like HOOKIPA are valued to inform your business strategies.
- Finance Students: Explore real-world valuation techniques using data from HOOKIPA Pharma Inc. and similar firms.
What the Template Contains
- Pre-Filled DCF Model: HOOKIPA Pharma Inc.’s financial data preloaded for immediate use.
- WACC Calculator: Detailed calculations for Weighted Average Cost of Capital.
- Financial Ratios: Evaluate HOOKIPA Pharma Inc.’s profitability, leverage, and efficiency.
- Editable Inputs: Change assumptions such as growth, margins, and CAPEX to fit your scenarios.
- Financial Statements: Annual and quarterly reports to support detailed analysis.
- Interactive Dashboard: Easily visualize key valuation metrics and results.
Disclaimer
All information, articles, and product details provided on this website are for general informational and educational purposes only. We do not claim any ownership over, nor do we intend to infringe upon, any trademarks, copyrights, logos, brand names, or other intellectual property mentioned or depicted on this site. Such intellectual property remains the property of its respective owners, and any references here are made solely for identification or informational purposes, without implying any affiliation, endorsement, or partnership.
We make no representations or warranties, express or implied, regarding the accuracy, completeness, or suitability of any content or products presented. Nothing on this website should be construed as legal, tax, investment, financial, medical, or other professional advice. In addition, no part of this site—including articles or product references—constitutes a solicitation, recommendation, endorsement, advertisement, or offer to buy or sell any securities, franchises, or other financial instruments, particularly in jurisdictions where such activity would be unlawful.
All content is of a general nature and may not address the specific circumstances of any individual or entity. It is not a substitute for professional advice or services. Any actions you take based on the information provided here are strictly at your own risk. You accept full responsibility for any decisions or outcomes arising from your use of this website and agree to release us from any liability in connection with your use of, or reliance upon, the content or products found herein.