
|
Hovnanian Enterprises, Inc. PFD DEP1/1000A (HOVNP) DCF -Bewertung |
Fully Editable: Tailor To Your Needs In Excel Or Sheets
Professional Design: Trusted, Industry-Standard Templates
Investor-Approved Valuation Models
MAC/PC Compatible, Fully Unlocked
No Expertise Is Needed; Easy To Follow
Hovnanian Enterprises, Inc. PFD DEP1/1000A (HOVNP) Bundle
Möchten Sie den inneren Wert von Hovnanian Enterprises, Inc. bewerten? Unser HOVNP -DCF -Taschenrechner integriert tatsächliche Marktdaten mit umfangreichen Anpassungsoptionen, sodass Sie Ihre Prognosen verfeinern und Ihre Anlagestrategien verbessern können.
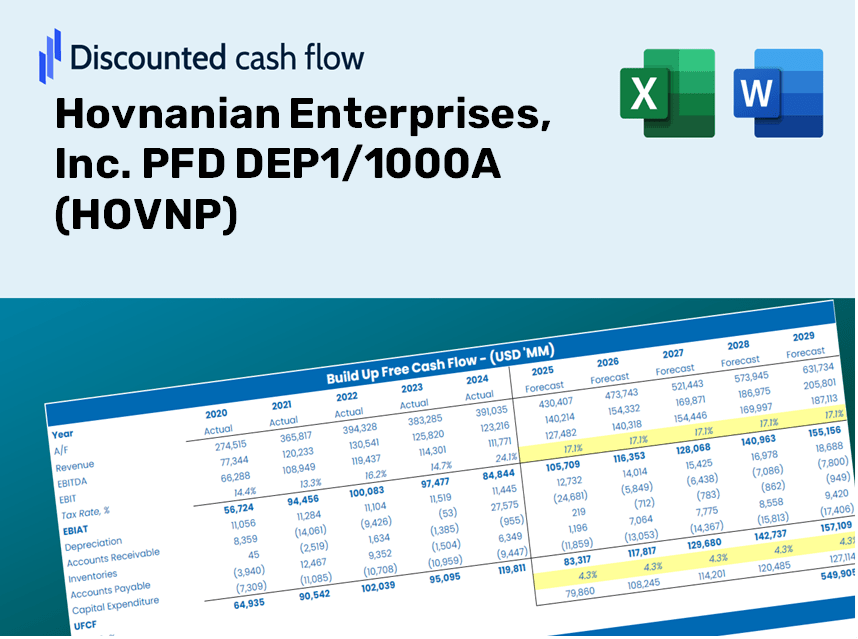
Discounted Cash Flow (DCF) - (USD MM)
| Year | AY1 2020 |
AY2 2021 |
AY3 2022 |
AY4 2023 |
AY5 2024 |
FY1 2025 |
FY2 2026 |
FY3 2027 |
FY4 2028 |
FY5 2029 |
|---|---|---|---|---|---|---|---|---|---|---|
| Revenue | 2,343.9 | 2,782.9 | 2,922.2 | 2,756.0 | 3,004.9 | 3,208.3 | 3,425.5 | 3,657.4 | 3,905.0 | 4,169.4 |
| Revenue Growth, % | 0 | 18.73 | 5.01 | -5.69 | 9.03 | 6.77 | 6.77 | 6.77 | 6.77 | 6.77 |
| EBITDA | 143.4 | 271.4 | 364.4 | 283.7 | 355.6 | 323.8 | 345.8 | 369.2 | 394.2 | 420.9 |
| EBITDA, % | 6.12 | 9.75 | 12.47 | 10.3 | 11.83 | 10.09 | 10.09 | 10.09 | 10.09 | 10.09 |
| Depreciation | 5.3 | 5.3 | 5.5 | 8.8 | 7.7 | 7.6 | 8.1 | 8.6 | 9.2 | 9.8 |
| Depreciation, % | 0.22629 | 0.18973 | 0.18674 | 0.31923 | 0.25724 | 0.23585 | 0.23585 | 0.23585 | 0.23585 | 0.23585 |
| EBIT | 138.1 | 266.1 | 358.9 | 274.9 | 347.8 | 316.3 | 337.7 | 360.5 | 385.0 | 411.0 |
| EBIT, % | 5.89 | 9.56 | 12.28 | 9.98 | 11.58 | 9.86 | 9.86 | 9.86 | 9.86 | 9.86 |
| Total Cash | 262.5 | 246.0 | 326.2 | 434.1 | 210.0 | 346.1 | 369.5 | 394.6 | 421.3 | 449.8 |
| Total Cash, percent | .0 | .0 | .0 | .0 | .0 | .0 | .0 | .0 | .0 | .0 |
| Account Receivables | 33.7 | 39.9 | 37.8 | 28.0 | 29.4 | 39.5 | 42.2 | 45.1 | 48.1 | 51.4 |
| Account Receivables, % | 1.44 | 1.44 | 1.29 | 1.02 | 0.9784 | 1.23 | 1.23 | 1.23 | 1.23 | 1.23 |
| Inventories | 1,195.8 | 1,254.3 | 1,519.2 | 1,349.2 | 1,644.8 | 1,615.5 | 1,724.9 | 1,841.6 | 1,966.3 | 2,099.4 |
| Inventories, % | 51.02 | 45.07 | 51.99 | 48.95 | 54.74 | 50.35 | 50.35 | 50.35 | 50.35 | 50.35 |
| Accounts Payable | 148.5 | 426.4 | 440.0 | 387.1 | 433.3 | 418.2 | 446.6 | 476.8 | 509.1 | 543.5 |
| Accounts Payable, % | 6.34 | 15.32 | 15.06 | 14.05 | 14.42 | 13.04 | 13.04 | 13.04 | 13.04 | 13.04 |
| Capital Expenditure | -3.4 | -5.9 | -12.6 | -18.8 | -17.9 | -13.3 | -14.2 | -15.1 | -16.1 | -17.2 |
| Capital Expenditure, % | -0.1442 | -0.21352 | -0.4309 | -0.68291 | -0.59433 | -0.41317 | -0.41317 | -0.41317 | -0.41317 | -0.41317 |
| Tax Rate, % | 23.68 | 23.68 | 23.68 | 23.68 | 23.68 | 23.68 | 23.68 | 23.68 | 23.68 | 23.68 |
| EBITAT | 127.0 | 851.9 | 253.1 | 221.2 | 265.5 | 265.2 | 283.1 | 302.3 | 322.8 | 344.6 |
| Depreciation | ||||||||||
| Changes in Account Receivables | ||||||||||
| Changes in Inventories | ||||||||||
| Changes in Accounts Payable | ||||||||||
| Capital Expenditure | ||||||||||
| UFCF | -952.0 | 1,064.4 | -3.3 | 338.2 | 4.4 | 263.6 | 193.3 | 206.4 | 220.4 | 235.3 |
| WACC, % | 8.09 | 8.25 | 7.65 | 7.86 | 7.77 | 7.92 | 7.92 | 7.92 | 7.92 | 7.92 |
| PV UFCF | ||||||||||
| SUM PV UFCF | 897.6 | |||||||||
| Long Term Growth Rate, % | 0.50 | |||||||||
| Free cash flow (T + 1) | 236 | |||||||||
| Terminal Value | 3,185 | |||||||||
| Present Terminal Value | 2,175 | |||||||||
| Enterprise Value | 3,073 | |||||||||
| Net Debt | 808 | |||||||||
| Equity Value | 2,265 | |||||||||
| Diluted Shares Outstanding, MM | 7 | |||||||||
| Equity Value Per Share | 323.27 |
Benefits You Will Receive
- Genuine Hovnanian Data: Preloaded financials – covering everything from revenue to EBIT – derived from actual and projected figures.
- Comprehensive Customization: Modify all essential parameters (yellow cells) such as WACC, growth %, and tax rates.
- Immediate Valuation Adjustments: Automatic recalculations to evaluate the effects of changes on Hovnanian Enterprises' fair value.
- Adaptable Excel Template: Designed for quick edits, scenario testing, and in-depth projections.
- Efficient and Precise: Eliminate the need to construct models from the ground up without sacrificing accuracy and flexibility.
Key Features
- 🔍 Real-Life HOVNP Financials: Pre-filled historical and projected data for Hovnanian Enterprises, Inc.
- ✏️ Fully Customizable Inputs: Adjust essential parameters (yellow cells) such as WACC, growth %, and tax rates.
- 📊 Professional DCF Valuation: Built-in formulas compute Hovnanian's intrinsic value using the Discounted Cash Flow method.
- ⚡ Instant Results: Visualize Hovnanian's valuation immediately after making any adjustments.
- Scenario Analysis: Evaluate and compare outcomes for different financial assumptions side-by-side.
How It Works
- Download: Obtain the pre-built Excel file containing Hovnanian Enterprises, Inc.'s (HOVNP) financial data.
- Customize: Modify forecasts, such as revenue growth, EBITDA %, and WACC to suit your analysis.
- Update Automatically: Calculations for intrinsic value and NPV adjust in real-time as you make changes.
- Test Scenarios: Generate various projections and compare results side by side effortlessly.
- Make Decisions: Leverage the valuation data to inform your investment strategy effectively.
Why Opt for This Calculator?
- User-Friendly and Accessible: Crafted for both novices and seasoned users.
- Customizable Inputs: Easily adjust parameters to suit your analysis needs.
- Real-Time Adjustments: Witness immediate updates to Hovnanian Enterprises, Inc.’s valuation as you modify inputs.
- Pre-Configured: Comes with Hovnanian's actual financial data for swift evaluation.
- Relied Upon by Experts: Employed by investors and analysts for informed decision-making.
Who Can Benefit from Hovnanian Enterprises, Inc. PFD DEP1/1000A (HOVNP)?
- Investors: Elevate your investment strategy with a reliable valuation tool tailored for informed decision-making.
- Financial Analysts: Enhance your efficiency with a customizable DCF model designed for quick implementation.
- Consultants: Seamlessly modify the template for impactful client presentations and detailed reports.
- Finance Enthusiasts: Expand your knowledge of valuation methodologies through practical, real-world case studies.
- Educators and Students: Leverage this resource as a hands-on learning aid in finance courses and workshops.
What the Template Includes
- Pre-Filled DCF Model: Hovnanian Enterprises, Inc.’s financial data preloaded for instant access.
- WACC Calculator: Comprehensive calculations for the Weighted Average Cost of Capital.
- Financial Ratios: Assess Hovnanian's profitability, leverage, and operational efficiency.
- Editable Inputs: Adjust key assumptions like growth rates, margins, and CAPEX to suit your projections.
- Financial Statements: Access annual and quarterly reports to facilitate thorough analysis.
- Interactive Dashboard: Visualize essential valuation metrics and outcomes with ease.
Disclaimer
All information, articles, and product details provided on this website are for general informational and educational purposes only. We do not claim any ownership over, nor do we intend to infringe upon, any trademarks, copyrights, logos, brand names, or other intellectual property mentioned or depicted on this site. Such intellectual property remains the property of its respective owners, and any references here are made solely for identification or informational purposes, without implying any affiliation, endorsement, or partnership.
We make no representations or warranties, express or implied, regarding the accuracy, completeness, or suitability of any content or products presented. Nothing on this website should be construed as legal, tax, investment, financial, medical, or other professional advice. In addition, no part of this site—including articles or product references—constitutes a solicitation, recommendation, endorsement, advertisement, or offer to buy or sell any securities, franchises, or other financial instruments, particularly in jurisdictions where such activity would be unlawful.
All content is of a general nature and may not address the specific circumstances of any individual or entity. It is not a substitute for professional advice or services. Any actions you take based on the information provided here are strictly at your own risk. You accept full responsibility for any decisions or outcomes arising from your use of this website and agree to release us from any liability in connection with your use of, or reliance upon, the content or products found herein.