
|
Hilltop Holdings Inc. (HTH) DCF -Bewertung |
Fully Editable: Tailor To Your Needs In Excel Or Sheets
Professional Design: Trusted, Industry-Standard Templates
Investor-Approved Valuation Models
MAC/PC Compatible, Fully Unlocked
No Expertise Is Needed; Easy To Follow
Hilltop Holdings Inc. (HTH) Bundle
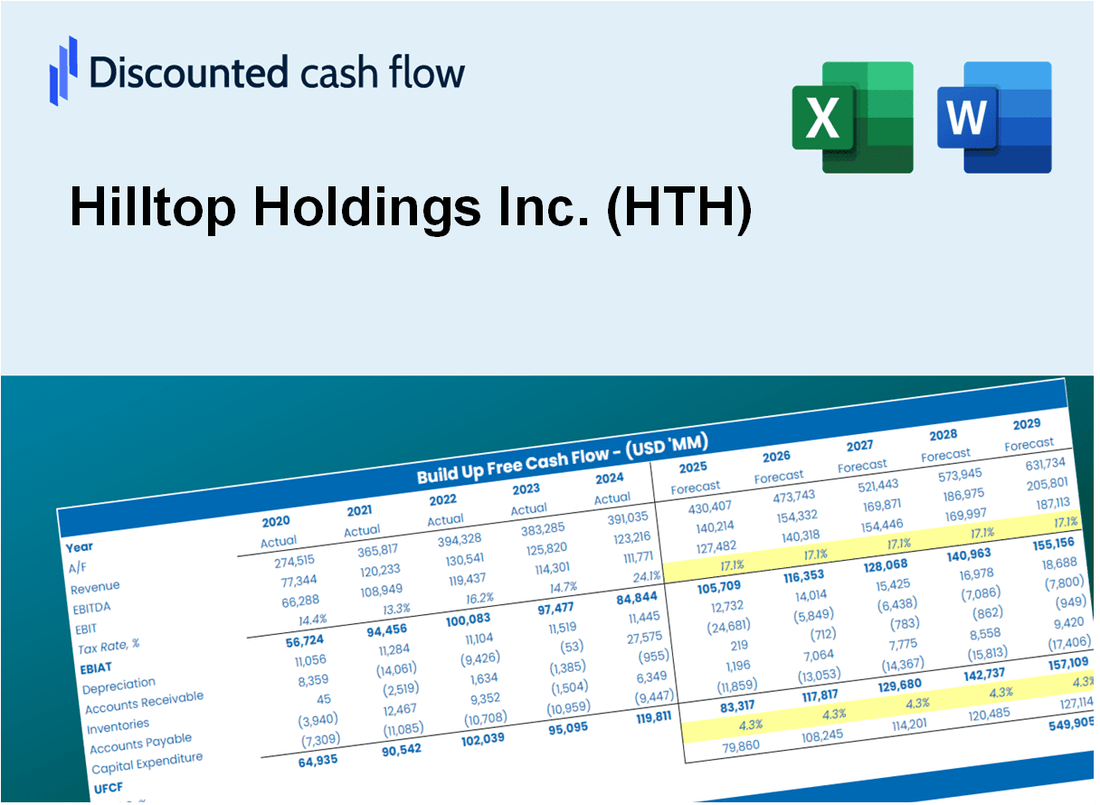
Bewerten Sie wie ein Experte Hilltop Holdings Inc. (HTH) finanzielle Aussichten! Dieser (HTH) DCF-Taschenrechner bietet Ihnen vorgefüllte Finanzdaten und die volle Flexibilität, um das Umsatzwachstum, die WACC, die Margen und andere kritische Annahmen zu ändern, um sich mit Ihren Vorhersagen auszurichten.
What You Will Get
- Editable Forecast Inputs: Easily modify assumptions (growth %, margins, WACC) to develop various scenarios.
- Real-World Data: Hilltop Holdings Inc. (HTH) financial data pre-filled to kickstart your analysis.
- Automatic DCF Outputs: The template computes Net Present Value (NPV) and intrinsic value automatically.
- Customizable and Professional: A sleek Excel model that adjusts to fit your valuation requirements.
- Built for Analysts and Investors: Perfect for evaluating projections, confirming strategies, and optimizing efficiency.
Key Features
- Comprehensive DCF Calculator: Offers detailed unlevered and levered DCF valuation models tailored for Hilltop Holdings Inc. (HTH).
- WACC Calculator: Features a pre-built Weighted Average Cost of Capital sheet with customizable inputs specific to HTH.
- Customizable Forecast Assumptions: Adjust growth rates, capital expenditures, and discount rates to fit Hilltop Holdings Inc. (HTH) projections.
- Integrated Financial Ratios: Evaluate profitability, leverage, and efficiency ratios relevant to Hilltop Holdings Inc. (HTH).
- Interactive Dashboard and Charts: Visual representations summarize essential valuation metrics for straightforward analysis of HTH.
How It Works
- 1. Access the Template: Download and open the Excel file containing Hilltop Holdings Inc.'s (HTH) financial data.
- 2. Modify Assumptions: Adjust key variables such as growth rates, WACC, and capital expenditures to fit your analysis.
- 3. Analyze Results Immediately: The DCF model automatically computes intrinsic value and NPV based on your inputs.
- 4. Explore Scenarios: Evaluate various forecasts to understand different valuation possibilities.
- 5. Present with Assurance: Deliver professional valuation findings to enhance your decision-making process.
Why Choose This Calculator for Hilltop Holdings Inc. (HTH)?
- Designed for Experts: A sophisticated tool utilized by financial analysts, CFOs, and investment consultants.
- Accurate Financial Data: Hilltop Holdings’ historical and projected financials are preloaded for precision.
- Flexible Scenario Analysis: Effortlessly simulate various forecasts and assumptions.
- Comprehensive Outputs: Automatically computes intrinsic value, NPV, and essential financial metrics.
- User-Friendly Interface: Step-by-step guidance ensures a smooth experience throughout the process.
Who Should Use Hilltop Holdings Inc. (HTH)?
- Institutional Investors: Develop comprehensive and trustworthy valuation models for investment portfolios.
- Corporate Finance Departments: Evaluate valuation scenarios to inform strategic decision-making.
- Financial Consultants: Deliver precise valuation assessments for clients interested in Hilltop Holdings Inc. (HTH).
- Academic Scholars: Leverage real-time data to enhance learning and teaching in financial analysis.
- Finance Enthusiasts: Gain insights into how financial institutions like Hilltop Holdings Inc. (HTH) are valued in the market.
What the Template Contains
- Historical Data: Includes Hilltop Holdings Inc.'s (HTH) past financials and baseline forecasts.
- DCF and Levered DCF Models: Detailed templates to calculate Hilltop Holdings Inc.'s (HTH) intrinsic value.
- WACC Sheet: Pre-built calculations for Weighted Average Cost of Capital.
- Editable Inputs: Modify key drivers like growth rates, EBITDA %, and CAPEX assumptions.
- Quarterly and Annual Statements: A complete breakdown of Hilltop Holdings Inc.'s (HTH) financials.
- Interactive Dashboard: Visualize valuation results and projections dynamically.
Disclaimer
All information, articles, and product details provided on this website are for general informational and educational purposes only. We do not claim any ownership over, nor do we intend to infringe upon, any trademarks, copyrights, logos, brand names, or other intellectual property mentioned or depicted on this site. Such intellectual property remains the property of its respective owners, and any references here are made solely for identification or informational purposes, without implying any affiliation, endorsement, or partnership.
We make no representations or warranties, express or implied, regarding the accuracy, completeness, or suitability of any content or products presented. Nothing on this website should be construed as legal, tax, investment, financial, medical, or other professional advice. In addition, no part of this site—including articles or product references—constitutes a solicitation, recommendation, endorsement, advertisement, or offer to buy or sell any securities, franchises, or other financial instruments, particularly in jurisdictions where such activity would be unlawful.
All content is of a general nature and may not address the specific circumstances of any individual or entity. It is not a substitute for professional advice or services. Any actions you take based on the information provided here are strictly at your own risk. You accept full responsibility for any decisions or outcomes arising from your use of this website and agree to release us from any liability in connection with your use of, or reliance upon, the content or products found herein.