
|
Hub Group, Inc. (HUBG) DCF -Bewertung |
Fully Editable: Tailor To Your Needs In Excel Or Sheets
Professional Design: Trusted, Industry-Standard Templates
Investor-Approved Valuation Models
MAC/PC Compatible, Fully Unlocked
No Expertise Is Needed; Easy To Follow
Hub Group, Inc. (HUBG) Bundle
Entdecken Sie das wahre Potenzial von Hub Group, Inc. (HUBG) mit unserem fortschrittlichen DCF -Taschenrechner! Passen Sie die wichtigsten Annahmen an, erkunden Sie verschiedene Szenarien und beurteilen Sie, wie unterschiedliche Faktoren die Bewertung der Hub -Gruppe beeinflussen - alles innerhalb einer bequemen Excel -Vorlage.
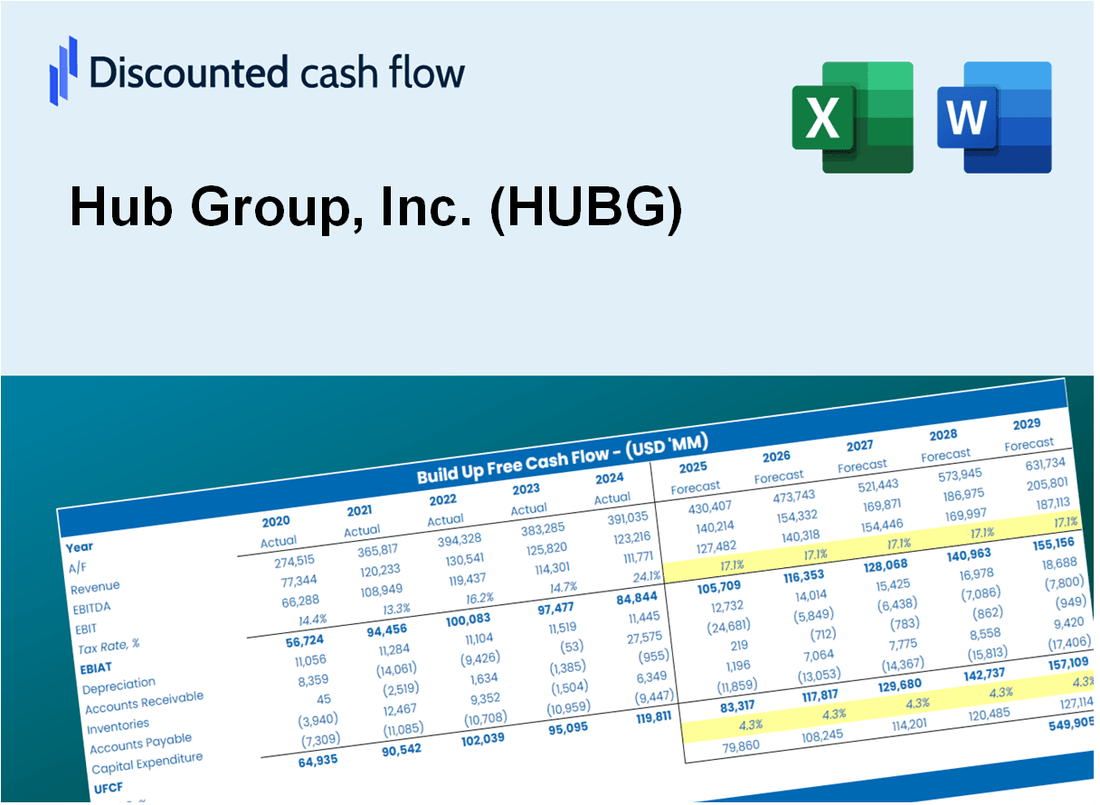
Discounted Cash Flow (DCF) - (USD MM)
| Year | AY1 2020 |
AY2 2021 |
AY3 2022 |
AY4 2023 |
AY5 2024 |
FY1 2025 |
FY2 2026 |
FY3 2027 |
FY4 2028 |
FY5 2029 |
|---|---|---|---|---|---|---|---|---|---|---|
| Revenue | 3,495.6 | 4,232.4 | 5,340.5 | 4,202.6 | 3,946.4 | 4,142.3 | 4,347.9 | 4,563.7 | 4,790.2 | 5,028.0 |
| Revenue Growth, % | 0 | 21.08 | 26.18 | -21.31 | -6.1 | 4.96 | 4.96 | 4.96 | 4.96 | 4.96 |
| EBITDA | 229.1 | 349.9 | 629.2 | 407.1 | 339.6 | 371.9 | 390.4 | 409.8 | 430.1 | 451.5 |
| EBITDA, % | 6.55 | 8.27 | 11.78 | 9.69 | 8.6 | 8.98 | 8.98 | 8.98 | 8.98 | 8.98 |
| Depreciation | 123.7 | 130.6 | 153.7 | 184.4 | 192.6 | 155.5 | 163.2 | 171.3 | 179.8 | 188.8 |
| Depreciation, % | 3.54 | 3.09 | 2.88 | 4.39 | 4.88 | 3.75 | 3.75 | 3.75 | 3.75 | 3.75 |
| EBIT | 105.4 | 219.3 | 475.5 | 222.6 | 147.0 | 216.4 | 227.2 | 238.4 | 250.3 | 262.7 |
| EBIT, % | 3.02 | 5.18 | 8.9 | 5.3 | 3.73 | 5.22 | 5.22 | 5.22 | 5.22 | 5.22 |
| Total Cash | 124.5 | 159.8 | 286.6 | 187.3 | 98.2 | 162.8 | 170.9 | 179.4 | 188.3 | 197.6 |
| Total Cash, percent | .0 | .0 | .0 | .0 | .0 | .0 | .0 | .0 | .0 | .0 |
| Account Receivables | 520.2 | 704.5 | 720.2 | 603.6 | 592.4 | 616.3 | 646.8 | 679.0 | 712.7 | 748.0 |
| Account Receivables, % | 14.88 | 16.65 | 13.48 | 14.36 | 15.01 | 14.88 | 14.88 | 14.88 | 14.88 | 14.88 |
| Inventories | 1.3 | 2.2 | 17.0 | .0 | .0 | 3.4 | 3.5 | 3.7 | 3.9 | 4.1 |
| Inventories, % | 0.03821899 | 0.05176753 | 0.31808 | 0 | 0 | 0.08161319 | 0.08161319 | 0.08161319 | 0.08161319 | 0.08161319 |
| Accounts Payable | 285.3 | 424.9 | 344.8 | 349.4 | 280.0 | 331.9 | 348.4 | 365.7 | 383.8 | 402.9 |
| Accounts Payable, % | 8.16 | 10.04 | 6.46 | 8.31 | 7.09 | 8.01 | 8.01 | 8.01 | 8.01 | 8.01 |
| Capital Expenditure | -115.3 | -133.0 | -219.1 | -140.1 | -50.8 | -125.6 | -131.9 | -138.4 | -145.3 | -152.5 |
| Capital Expenditure, % | -3.3 | -3.14 | -4.1 | -3.33 | -1.29 | -3.03 | -3.03 | -3.03 | -3.03 | -3.03 |
| Tax Rate, % | 21.54 | 21.54 | 21.54 | 21.54 | 21.54 | 21.54 | 21.54 | 21.54 | 21.54 | 21.54 |
| EBITAT | 80.7 | 162.8 | 362.7 | 178.3 | 115.3 | 166.9 | 175.2 | 183.9 | 193.0 | 202.6 |
| Depreciation | ||||||||||
| Changes in Account Receivables | ||||||||||
| Changes in Inventories | ||||||||||
| Changes in Accounts Payable | ||||||||||
| Capital Expenditure | ||||||||||
| UFCF | -147.2 | 115.0 | 186.7 | 360.9 | 198.8 | 221.5 | 192.3 | 201.8 | 211.8 | 222.4 |
| WACC, % | 8.01 | 8 | 8.01 | 8.04 | 8.03 | 8.02 | 8.02 | 8.02 | 8.02 | 8.02 |
| PV UFCF | ||||||||||
| SUM PV UFCF | 836.8 | |||||||||
| Long Term Growth Rate, % | 0.50 | |||||||||
| Free cash flow (T + 1) | 223 | |||||||||
| Terminal Value | 2,972 | |||||||||
| Present Terminal Value | 2,021 | |||||||||
| Enterprise Value | 2,858 | |||||||||
| Net Debt | 410 | |||||||||
| Equity Value | 2,448 | |||||||||
| Diluted Shares Outstanding, MM | 61 | |||||||||
| Equity Value Per Share | 40.06 |
What You Will Get
- Real Hub Group Data: Preloaded financials – from revenue to EBIT – based on actual and projected figures.
- Full Customization: Adjust all critical parameters (yellow cells) like WACC, growth %, and tax rates.
- Instant Valuation Updates: Automatic recalculations to analyze the impact of changes on Hub Group’s fair value.
- Versatile Excel Template: Tailored for quick edits, scenario testing, and detailed projections.
- Time-Saving and Accurate: Skip building models from scratch while maintaining precision and flexibility.
Key Features
- Comprehensive Financial Data: Hub Group, Inc.'s historical financial statements and pre-filled projections.
- Customizable Parameters: Modify WACC, tax rates, revenue growth, and EBITDA margins as needed.
- Real-Time Valuation: Observe Hub Group's intrinsic value recalculating instantly.
- Intuitive Visualizations: Dashboard graphs present valuation outcomes and essential metrics clearly.
- Designed for Precision: A reliable tool for analysts, investors, and finance professionals.
How It Works
- 1. Download the Template: Obtain and open the Excel file containing Hub Group, Inc.'s (HUBG) preloaded data.
- 2. Adjust Key Inputs: Modify essential parameters such as growth rates, WACC, and capital expenditures.
- 3. Analyze Results Immediately: The DCF model automatically computes intrinsic value and NPV in real-time.
- 4. Explore Different Scenarios: Evaluate various forecasts to understand different valuation results.
- 5. Present with Assurance: Deliver expert valuation insights to bolster your decision-making process.
Why Choose This Calculator for Hub Group, Inc. (HUBG)?
- Designed for Industry Experts: A sophisticated tool favored by logistics analysts, CFOs, and supply chain consultants.
- Accurate Data: Hub Group’s historical and forecasted financials integrated for precision.
- Flexible Scenario Analysis: Effortlessly model various logistics forecasts and assumptions.
- Comprehensive Outputs: Instantly calculates intrinsic value, NPV, and essential performance metrics.
- User-Friendly Interface: Detailed, step-by-step guidance ensures a smooth calculation process.
Who Should Use Hub Group, Inc. (HUBG)?
- Logistics Students: Understand supply chain management and apply concepts using real-world data.
- Researchers: Utilize industry-specific models in academic studies or publications.
- Investors: Evaluate your investment strategies and analyze the performance of Hub Group, Inc. (HUBG).
- Industry Analysts: Enhance your analysis with a tailored, ready-to-use financial model.
- Entrepreneurs: Learn how large logistics firms like Hub Group, Inc. (HUBG) are assessed in the market.
What the Template Contains
- Preloaded HUBG Data: Historical and projected financial data, including revenue, EBIT, and capital expenditures.
- DCF and WACC Models: Professional-grade sheets for calculating intrinsic value and Weighted Average Cost of Capital.
- Editable Inputs: Yellow-highlighted cells for adjusting revenue growth, tax rates, and discount rates.
- Financial Statements: Comprehensive annual and quarterly financials for deeper analysis.
- Key Ratios: Profitability, leverage, and efficiency ratios to evaluate performance.
- Dashboard and Charts: Visual summaries of valuation outcomes and assumptions.
Disclaimer
All information, articles, and product details provided on this website are for general informational and educational purposes only. We do not claim any ownership over, nor do we intend to infringe upon, any trademarks, copyrights, logos, brand names, or other intellectual property mentioned or depicted on this site. Such intellectual property remains the property of its respective owners, and any references here are made solely for identification or informational purposes, without implying any affiliation, endorsement, or partnership.
We make no representations or warranties, express or implied, regarding the accuracy, completeness, or suitability of any content or products presented. Nothing on this website should be construed as legal, tax, investment, financial, medical, or other professional advice. In addition, no part of this site—including articles or product references—constitutes a solicitation, recommendation, endorsement, advertisement, or offer to buy or sell any securities, franchises, or other financial instruments, particularly in jurisdictions where such activity would be unlawful.
All content is of a general nature and may not address the specific circumstances of any individual or entity. It is not a substitute for professional advice or services. Any actions you take based on the information provided here are strictly at your own risk. You accept full responsibility for any decisions or outcomes arising from your use of this website and agree to release us from any liability in connection with your use of, or reliance upon, the content or products found herein.