
|
Hawkins, Inc. (HWKN) DCF -Bewertung |
Fully Editable: Tailor To Your Needs In Excel Or Sheets
Professional Design: Trusted, Industry-Standard Templates
Investor-Approved Valuation Models
MAC/PC Compatible, Fully Unlocked
No Expertise Is Needed; Easy To Follow
Hawkins, Inc. (HWKN) Bundle
Verbessern Sie Ihre Anlagestrategie mit dem DCF -Taschenrechner von Hawkins, Inc. (HWKN)! Erforschen Sie authentische Finanzdaten für Hawkins, Inc., stellen Sie Wachstumsprognosen und -kosten an und beachten Sie sofort, wie sich diese Veränderungen auf den inneren Wert von Hawkins, Inc. (HWKN) auswirken.
What You Will Receive
- Customizable Excel Template: A fully adjustable Excel-based DCF Calculator featuring pre-filled real HWKN financials.
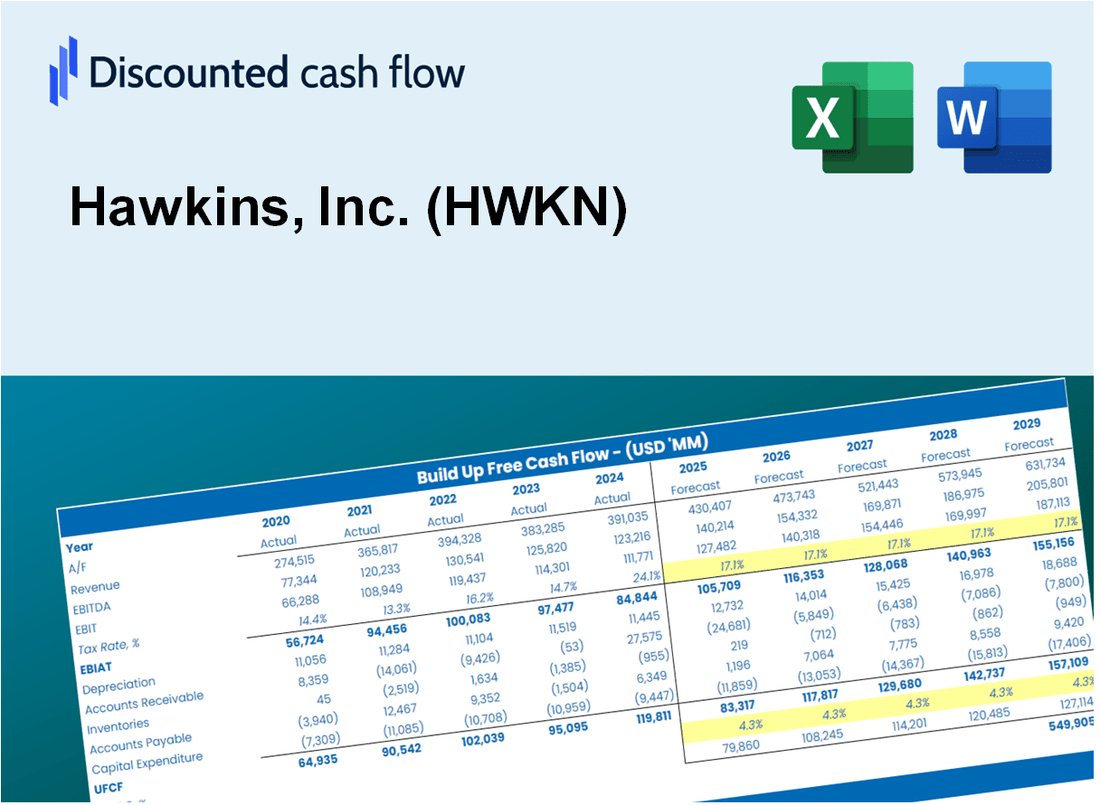
- Comprehensive Data: Historical performance data and forward-looking projections (highlighted in the yellow cells).
- Flexible Forecasting: Modify forecast assumptions such as revenue growth, EBITDA %, and WACC.
- Instant Calculations: Quickly observe how your inputs affect Hawkins, Inc.’s valuation.
- Professional Resource: Designed for investors, CFOs, consultants, and financial analysts.
- User-Centric Layout: Organized for clarity and ease of navigation, complete with step-by-step guidance.
Key Features
- Comprehensive HWKN Data: Pre-filled with Hawkins, Inc.'s historical financials and future projections.
- Fully Customizable Inputs: Modify revenue growth, profit margins, WACC, tax rates, and capital expenditures as needed.
- Dynamic Valuation Model: Automatic updates to Net Present Value (NPV) and intrinsic value based on user inputs.
- Scenario Analysis: Develop multiple forecasting scenarios to evaluate various valuation outcomes.
- User-Friendly Interface: Intuitive, structured, and suitable for both professionals and newcomers.
How It Works
- 1. Access the Template: Download and open the Excel file containing Hawkins, Inc. (HWKN)’s preloaded data.
- 2. Modify Assumptions: Adjust key inputs such as growth rates, WACC, and capital expenditures.
- 3. Analyze Results Instantly: The DCF model automatically computes intrinsic value and NPV.
- 4. Explore Scenarios: Evaluate various forecasts to assess different valuation outcomes.
- 5. Present with Assurance: Deliver professional valuation insights to back your decisions.
Why Choose the Hawkins, Inc. (HWKN) Calculator?
- Accurate Data: Real Hawkins, Inc. financials provide trustworthy valuation outcomes.
- Customizable: Modify essential parameters like growth rates, WACC, and tax rates to fit your forecasts.
- Time-Saving: Pre-configured calculations save you the hassle of starting from the ground up.
- Professional-Grade Tool: Tailored for investors, analysts, and consultants in the field.
- User-Friendly: Easy-to-navigate design and clear instructions make it accessible for everyone.
Who Should Use This Product?
- Investors: Evaluate Hawkins, Inc.'s (HWKN) performance before making investment decisions.
- CFOs and Financial Analysts: Optimize financial assessments and validate forecasts for Hawkins, Inc. (HWKN).
- Startup Founders: Discover valuation methodologies used for established companies like Hawkins, Inc. (HWKN).
- Consultants: Provide comprehensive valuation analyses and reports for clients involving Hawkins, Inc. (HWKN).
- Students and Educators: Utilize data from Hawkins, Inc. (HWKN) to enhance learning and practice valuation skills.
What the Template Contains
- Preloaded HWKN Data: Historical and projected financial data, including revenue, EBIT, and capital expenditures.
- DCF and WACC Models: Professional-grade sheets for calculating intrinsic value and Weighted Average Cost of Capital.
- Editable Inputs: Yellow-highlighted cells for adjusting revenue growth, tax rates, and discount rates.
- Financial Statements: Comprehensive annual and quarterly financials for deeper analysis.
- Key Ratios: Profitability, leverage, and efficiency ratios to evaluate performance.
- Dashboard and Charts: Visual summaries of valuation outcomes and assumptions.
Disclaimer
All information, articles, and product details provided on this website are for general informational and educational purposes only. We do not claim any ownership over, nor do we intend to infringe upon, any trademarks, copyrights, logos, brand names, or other intellectual property mentioned or depicted on this site. Such intellectual property remains the property of its respective owners, and any references here are made solely for identification or informational purposes, without implying any affiliation, endorsement, or partnership.
We make no representations or warranties, express or implied, regarding the accuracy, completeness, or suitability of any content or products presented. Nothing on this website should be construed as legal, tax, investment, financial, medical, or other professional advice. In addition, no part of this site—including articles or product references—constitutes a solicitation, recommendation, endorsement, advertisement, or offer to buy or sell any securities, franchises, or other financial instruments, particularly in jurisdictions where such activity would be unlawful.
All content is of a general nature and may not address the specific circumstances of any individual or entity. It is not a substitute for professional advice or services. Any actions you take based on the information provided here are strictly at your own risk. You accept full responsibility for any decisions or outcomes arising from your use of this website and agree to release us from any liability in connection with your use of, or reliance upon, the content or products found herein.