
|
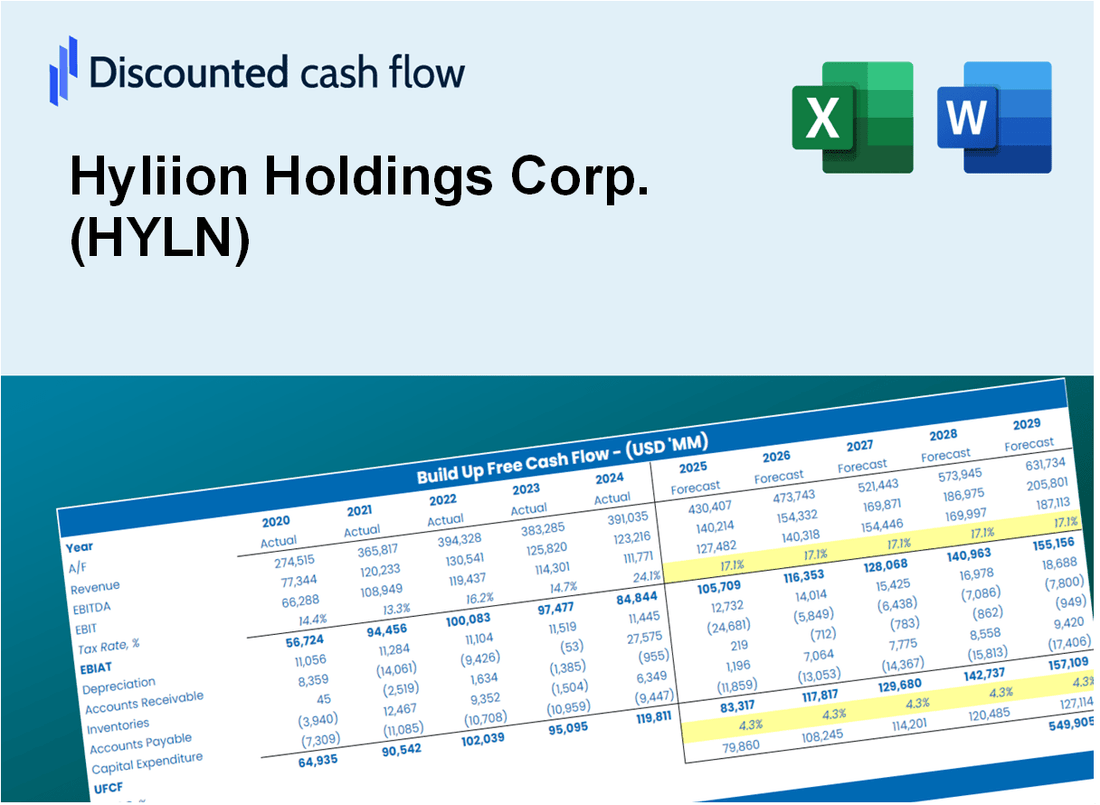
Hyliion Holdings Corp. (HYLN) DCF -Bewertung |
Fully Editable: Tailor To Your Needs In Excel Or Sheets
Professional Design: Trusted, Industry-Standard Templates
Investor-Approved Valuation Models
MAC/PC Compatible, Fully Unlocked
No Expertise Is Needed; Easy To Follow
Hyliion Holdings Corp. (HYLN) Bundle
Vereinfachen Sie die Bewertung der Hyliion Holdings Corp. (HYLN) mit diesem anpassbaren DCF -Taschenrechner! Mit Real Hyliion Holdings Corp. (HYLN) -Fonds und einstellbaren Prognoseeingaben können Sie Szenarien testen und Hyliion Holdings Corp. (HYLN) in wenigen Minuten aufdecken.
Discounted Cash Flow (DCF) - (USD MM)
| Year | AY1 2020 |
AY2 2021 |
AY3 2022 |
AY4 2023 |
AY5 2024 |
FY1 2025 |
FY2 2026 |
FY3 2027 |
FY4 2028 |
FY5 2029 |
|---|---|---|---|---|---|---|---|---|---|---|
| Revenue | .0 | .2 | 2.1 | .7 | 1.5 | 2.0 | 2.7 | 3.5 | 4.7 | 6.3 |
| Revenue Growth, % | 0 | 0 | 953 | -68.09 | 124.55 | 32.98 | 32.98 | 32.98 | 32.98 | 32.98 |
| EBITDA | 331.4 | -95.2 | -157.8 | -122.4 | -58.1 | -1.2 | -1.6 | -2.1 | -2.8 | -3.8 |
| EBITDA, % | 100 | -47582 | -7493.02 | -18211.9 | -3853.21 | -60 | -60 | -60 | -60 | -60 |
| Depreciation | 1.8 | .9 | 1.2 | 3.5 | 3.1 | 1.8 | 2.4 | 3.3 | 4.3 | 5.8 |
| Depreciation, % | 100 | 442 | 58.26 | 522.47 | 208.55 | 91.65 | 91.65 | 91.65 | 91.65 | 91.65 |
| EBIT | 329.6 | -96.0 | -159.0 | -125.9 | -61.3 | -1.2 | -1.6 | -2.1 | -2.8 | -3.8 |
| EBIT, % | 100 | -48024 | -7551.28 | -18734.37 | -4061.76 | -60 | -60 | -60 | -60 | -60 |
| Total Cash | 591.6 | 377.2 | 313.2 | 163.2 | 120.1 | 2.0 | 2.7 | 3.5 | 4.7 | 6.3 |
| Total Cash, percent | .0 | .2 | .0 | .0 | .0 | .0 | .0 | .0 | .0 | .0 |
| Account Receivables | .1 | .1 | 1.1 | .0 | 1.9 | 1.2 | 1.6 | 2.1 | 2.8 | 3.7 |
| Account Receivables, % | 100 | 35 | 53.94 | 5.95 | 127.44 | 58.98 | 58.98 | 58.98 | 58.98 | 58.98 |
| Inventories | .1 | .1 | .1 | .0 | .0 | .6 | .9 | 1.1 | 1.5 | 2.0 |
| Inventories, % | 100 | 57 | 3.51 | 0 | 0 | 32.1 | 32.1 | 32.1 | 32.1 | 32.1 |
| Accounts Payable | 1.9 | 7.5 | 2.8 | 4.2 | 5.2 | 2.0 | 2.7 | 3.5 | 4.7 | 6.3 |
| Accounts Payable, % | 100 | 3727.5 | 132.95 | 628.57 | 347.45 | 100 | 100 | 100 | 100 | 100 |
| Capital Expenditure | -.3 | -2.4 | -17.3 | -7.4 | -16.5 | -1.6 | -2.1 | -2.8 | -3.8 | -5.0 |
| Capital Expenditure, % | 100 | -1190 | -822.08 | -1101.34 | -1095.1 | -80 | -80 | -80 | -80 | -80 |
| Tax Rate, % | 0 | 0 | 0 | 0 | 0 | 0 | 0 | 0 | 0 | 0 |
| EBITAT | -45.4 | -96.0 | -159.0 | -125.9 | -61.3 | -1.0 | -1.3 | -1.7 | -2.3 | -3.0 |
| Depreciation | ||||||||||
| Changes in Account Receivables | ||||||||||
| Changes in Inventories | ||||||||||
| Changes in Accounts Payable | ||||||||||
| Capital Expenditure | ||||||||||
| UFCF | -42.2 | -91.9 | -180.8 | -127.2 | -75.5 | -3.9 | -.9 | -1.2 | -1.6 | -2.1 |
| WACC, % | 15.15 | 15.23 | 15.23 | 15.23 | 15.23 | 15.22 | 15.22 | 15.22 | 15.22 | 15.22 |
| PV UFCF | ||||||||||
| SUM PV UFCF | -6.8 | |||||||||
| Long Term Growth Rate, % | 2.00 | |||||||||
| Free cash flow (T + 1) | -2 | |||||||||
| Terminal Value | -17 | |||||||||
| Present Terminal Value | -8 | |||||||||
| Enterprise Value | -15 | |||||||||
| Net Debt | -2 | |||||||||
| Equity Value | -13 | |||||||||
| Diluted Shares Outstanding, MM | 175 | |||||||||
| Equity Value Per Share | -0.07 |
What You Will Receive
- Adjustable Forecast Parameters: Modify key assumptions (growth %, margins, WACC) to explore various scenarios.
- Real-World Insights: Hyliion’s financial data pre-populated to facilitate your analysis.
- Automated DCF Calculations: The template computes Net Present Value (NPV) and intrinsic value automatically.
- Tailored and Professional: A refined Excel model that meets your valuation requirements.
- Designed for Analysts and Investors: Perfect for evaluating projections, confirming strategies, and enhancing efficiency.
Key Features
- Comprehensive DCF Calculator: Features both unlevered and levered DCF valuation models tailored for Hyliion Holdings Corp. (HYLN).
- WACC Calculator: User-friendly Weighted Average Cost of Capital sheet with adjustable parameters.
- Customizable Forecast Assumptions: Adjust growth rates, capital expenditures, and discount rates as needed.
- Integrated Financial Ratios: Evaluate profitability, leverage, and efficiency ratios specific to Hyliion Holdings Corp. (HYLN).
- Interactive Dashboard and Charts: Visual representations highlight essential valuation metrics for straightforward analysis.
How It Works
- Download the Template: Gain immediate access to the Excel-based HYLN DCF Calculator.
- Input Your Assumptions: Modify the yellow-highlighted cells for growth rates, WACC, margins, and additional parameters.
- Instant Calculations: The model automatically recalculates Hyliion’s intrinsic value.
- Test Scenarios: Experiment with various assumptions to assess potential valuation shifts.
- Analyze and Decide: Utilize the outcomes to inform your investment or financial strategies.
Why Choose Hyliion Holdings Corp. (HYLN)?
- Innovative Technology: Leverage cutting-edge solutions for sustainable transportation.
- Proven Performance: Benefit from a track record of successful deployments and partnerships.
- Scalable Solutions: Adaptable products designed to meet the needs of various fleets.
- Expert Insights: Access valuable market analysis and industry expertise from thought leaders.
- Commitment to Sustainability: Join a mission focused on reducing carbon emissions and enhancing efficiency.
Who Should Use This Product?
- Individual Investors: Make informed decisions about buying or selling Hyliion Holdings Corp. (HYLN) stock.
- Financial Analysts: Streamline valuation processes with ready-to-use financial models for Hyliion Holdings Corp. (HYLN).
- Consultants: Deliver professional valuation insights on Hyliion Holdings Corp. (HYLN) to clients quickly and accurately.
- Business Owners: Understand how companies like Hyliion Holdings Corp. (HYLN) are valued to guide your own strategy.
- Finance Students: Learn valuation techniques using real-world data and scenarios related to Hyliion Holdings Corp. (HYLN).
What the Template Contains
- Comprehensive DCF Model: Editable template with detailed valuation calculations specific to Hyliion Holdings Corp. (HYLN).
- Real-World Data: Hyliion's historical and projected financials preloaded for analysis.
- Customizable Parameters: Adjust WACC, growth rates, and tax assumptions to test various scenarios.
- Financial Statements: Full annual and quarterly breakdowns for deeper insights into Hyliion's performance.
- Key Ratios: Built-in analysis for profitability, efficiency, and leverage tailored to Hyliion Holdings Corp. (HYLN).
- Dashboard with Visual Outputs: Charts and tables for clear, actionable results regarding Hyliion's financial health.
Disclaimer
All information, articles, and product details provided on this website are for general informational and educational purposes only. We do not claim any ownership over, nor do we intend to infringe upon, any trademarks, copyrights, logos, brand names, or other intellectual property mentioned or depicted on this site. Such intellectual property remains the property of its respective owners, and any references here are made solely for identification or informational purposes, without implying any affiliation, endorsement, or partnership.
We make no representations or warranties, express or implied, regarding the accuracy, completeness, or suitability of any content or products presented. Nothing on this website should be construed as legal, tax, investment, financial, medical, or other professional advice. In addition, no part of this site—including articles or product references—constitutes a solicitation, recommendation, endorsement, advertisement, or offer to buy or sell any securities, franchises, or other financial instruments, particularly in jurisdictions where such activity would be unlawful.
All content is of a general nature and may not address the specific circumstances of any individual or entity. It is not a substitute for professional advice or services. Any actions you take based on the information provided here are strictly at your own risk. You accept full responsibility for any decisions or outcomes arising from your use of this website and agree to release us from any liability in connection with your use of, or reliance upon, the content or products found herein.