
|
ImmunityBio, Inc. (IBRX) DCF -Bewertung |
Fully Editable: Tailor To Your Needs In Excel Or Sheets
Professional Design: Trusted, Industry-Standard Templates
Investor-Approved Valuation Models
MAC/PC Compatible, Fully Unlocked
No Expertise Is Needed; Easy To Follow
ImmunityBio, Inc. (IBRX) Bundle
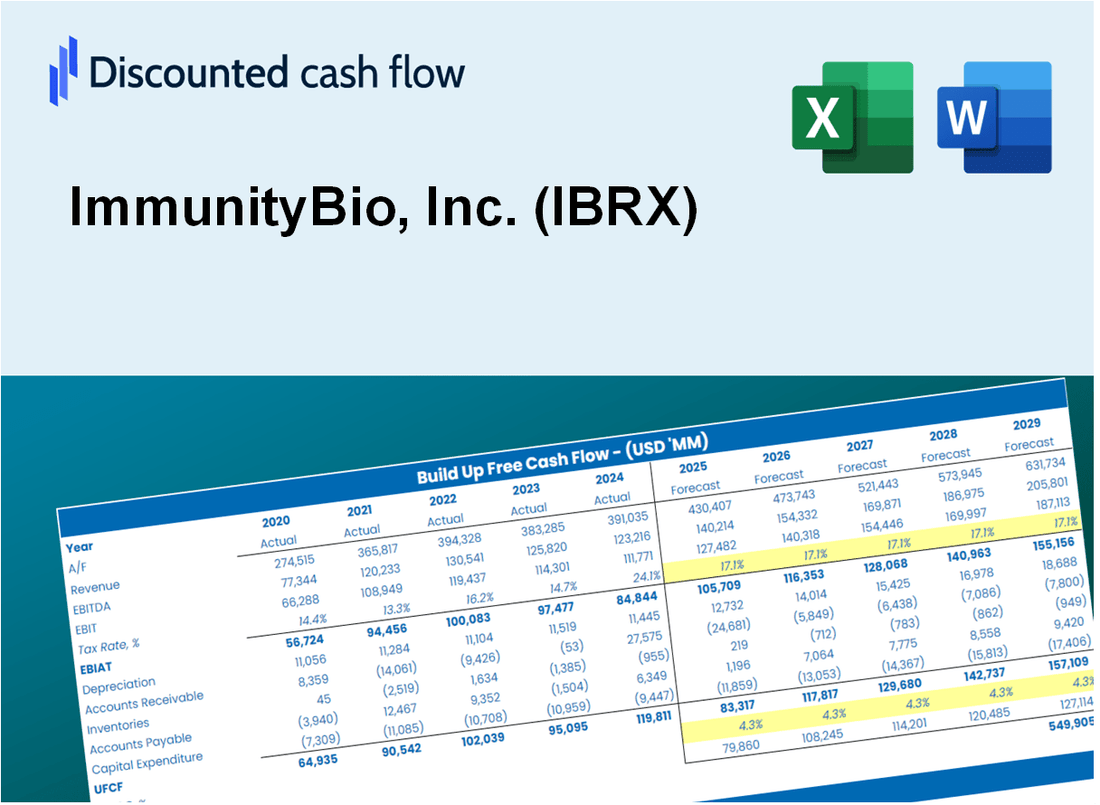
Als Anleger oder Analyst ist dieser [Symbol] DCF-Taschenrechner Ihre Anlaufstelle für eine genaue Bewertung. Mit realen Daten von ImmunityBio, Inc. geladen, können Sie Prognosen problemlos anpassen und die Auswirkungen in Echtzeit beobachten.
Discounted Cash Flow (DCF) - (USD MM)
| Year | AY1 2020 |
AY2 2021 |
AY3 2022 |
AY4 2023 |
AY5 2024 |
FY1 2025 |
FY2 2026 |
FY3 2027 |
FY4 2028 |
FY5 2029 |
|---|---|---|---|---|---|---|---|---|---|---|
| Revenue | .6 | .9 | .2 | .6 | 14.7 | 21.4 | 31.0 | 45.0 | 65.2 | 94.6 |
| Revenue Growth, % | 0 | 54.38 | -74.3 | 159.17 | 2270.58 | 45.02 | 45.02 | 45.02 | 45.02 | 45.02 |
| EBITDA | -187.9 | -320.8 | -351.9 | -478.7 | -264.4 | -21.4 | -31.0 | -45.0 | -65.2 | -94.6 |
| EBITDA, % | -31063.47 | -34341.76 | -146617.08 | -76955.47 | -1793.37 | -100 | -100 | -100 | -100 | -100 |
| Depreciation | 9.1 | 14.2 | 18.3 | 18.5 | 17.6 | 21.4 | 31.0 | 45.0 | 65.2 | 94.6 |
| Depreciation, % | 1511.9 | 1524.41 | 7608.33 | 2976.21 | 119.05 | 100 | 100 | 100 | 100 | 100 |
| EBIT | -197.1 | -335.0 | -370.1 | -497.2 | -282.0 | -21.4 | -31.0 | -45.0 | -65.2 | -94.6 |
| EBIT, % | -32575.37 | -35866.17 | -154225.42 | -79931.67 | -1912.42 | -100 | -100 | -100 | -100 | -100 |
| Total Cash | 96.1 | 317.1 | 107.2 | 266.5 | 149.8 | 21.4 | 31.0 | 45.0 | 65.2 | 94.6 |
| Total Cash, percent | .0 | .0 | .0 | .0 | .0 | .0 | .0 | .0 | .0 | .0 |
| Account Receivables | 2.0 | 1.3 | 1.9 | 3.2 | 2.7 | 17.9 | 25.9 | 37.6 | 54.5 | 79.1 |
| Account Receivables, % | 331.07 | 142.72 | 787.5 | 509.32 | 17.99 | 83.6 | 83.6 | 83.6 | 83.6 | 83.6 |
| Inventories | .0 | .0 | .0 | .0 | 8.3 | 2.4 | 3.5 | 5.0 | 7.3 | 10.6 |
| Inventories, % | 0 | 0 | 0 | 0 | 56.1 | 11.22 | 11.22 | 11.22 | 11.22 | 11.22 |
| Accounts Payable | 11.5 | 11.4 | 21.0 | 9.2 | 6.7 | 19.1 | 27.6 | 40.1 | 58.1 | 84.3 |
| Accounts Payable, % | 1902.48 | 1222.48 | 8756.67 | 1478.3 | 45.61 | 89.12 | 89.12 | 89.12 | 89.12 | 89.12 |
| Capital Expenditure | -1.7 | -33.6 | -78.2 | -30.6 | -6.9 | -19.1 | -27.7 | -40.2 | -58.3 | -84.5 |
| Capital Expenditure, % | -275.87 | -3593.47 | -32567.5 | -4917.04 | -46.71 | -89.34 | -89.34 | -89.34 | -89.34 | -89.34 |
| Tax Rate, % | 0.01958201 | 0.01958201 | 0.01958201 | 0.01958201 | 0.01958201 | 0.01958201 | 0.01958201 | 0.01958201 | 0.01958201 | 0.01958201 |
| EBITAT | -195.5 | -332.1 | -369.5 | -496.6 | -281.9 | -21.3 | -30.9 | -44.8 | -65.0 | -94.2 |
| Depreciation | ||||||||||
| Changes in Account Receivables | ||||||||||
| Changes in Inventories | ||||||||||
| Changes in Accounts Payable | ||||||||||
| Capital Expenditure | ||||||||||
| UFCF | -178.5 | -350.8 | -420.4 | -521.8 | -281.5 | -16.0 | -28.1 | -40.8 | -59.2 | -85.8 |
| WACC, % | 10.14 | 10.13 | 10.18 | 10.19 | 10.19 | 10.17 | 10.17 | 10.17 | 10.17 | 10.17 |
| PV UFCF | ||||||||||
| SUM PV UFCF | -161.3 | |||||||||
| Long Term Growth Rate, % | 2.00 | |||||||||
| Free cash flow (T + 1) | -88 | |||||||||
| Terminal Value | -1,072 | |||||||||
| Present Terminal Value | -660 | |||||||||
| Enterprise Value | -822 | |||||||||
| Net Debt | 361 | |||||||||
| Equity Value | -1,182 | |||||||||
| Diluted Shares Outstanding, MM | 700 | |||||||||
| Equity Value Per Share | -1.69 |
What You Will Get
- Real IBRX Financial Data: Pre-filled with ImmunityBio’s historical and projected data for precise analysis.
- Fully Editable Template: Modify key inputs like revenue growth, WACC, and EBITDA % with ease.
- Automatic Calculations: See ImmunityBio’s intrinsic value update instantly based on your changes.
- Professional Valuation Tool: Designed for investors, analysts, and consultants seeking accurate DCF results.
- User-Friendly Design: Simple structure and clear instructions for all experience levels.
Key Features
- Customizable Clinical Parameters: Adjust key inputs such as patient demographics, treatment efficacy, and trial timelines.
- Instant DCF Valuation: Automatically computes intrinsic value, NPV, and other essential metrics in real-time.
- High-Precision Accuracy: Leverages ImmunityBio's real-world data for credible valuation results.
- Seamless Scenario Analysis: Easily explore various assumptions and evaluate their impacts on outcomes.
- Efficiency Booster: Streamlines the valuation process, removing the need for complex model construction.
How It Works
- Step 1: Download the prebuilt Excel template featuring ImmunityBio's (IBRX) data.
- Step 2: Navigate through the pre-filled sheets to familiarize yourself with the essential metrics.
- Step 3: Modify forecasts and assumptions in the editable yellow cells (WACC, growth, margins).
- Step 4: Instantly see recalculated results, including ImmunityBio's (IBRX) intrinsic value.
- Step 5: Make well-informed investment choices or create reports based on the outputs.
Why Choose This Calculator for ImmunityBio, Inc. (IBRX)?
- User-Friendly Interface: Tailored for both novice users and seasoned professionals.
- Customizable Inputs: Adjust parameters easily to suit your specific analysis needs.
- Real-Time Feedback: Observe immediate updates to ImmunityBio’s valuation as you modify inputs.
- Pre-Loaded Data: Comes with ImmunityBio’s actual financial figures for swift evaluations.
- Endorsed by Experts: Utilized by investors and analysts for making well-informed decisions.
Who Should Use This Product?
- Healthcare Investors: Make informed decisions with a robust analysis tool tailored for biotech investments.
- Biotech Analysts: Streamline your workflow with a customizable financial model specific to ImmunityBio, Inc. (IBRX).
- Consultants: Effortlessly modify the template for client reports or presentations about ImmunityBio, Inc. (IBRX).
- Biotech Enthusiasts: Expand your knowledge of the biotech sector using real-world examples from ImmunityBio, Inc. (IBRX).
- Educators and Students: Utilize it as a hands-on learning resource in biotechnology and finance courses.
What the Template Contains
- Pre-Filled Data: Includes ImmunityBio’s historical financials and projections.
- Discounted Cash Flow Model: Editable DCF valuation model featuring automatic calculations.
- Weighted Average Cost of Capital (WACC): A dedicated sheet for computing WACC based on user-defined inputs.
- Key Financial Ratios: Assess ImmunityBio’s profitability, efficiency, and leverage metrics.
- Customizable Inputs: Easily modify revenue growth, profit margins, and tax rates.
- Clear Dashboard: Visuals and tables summarizing essential valuation outcomes.
Disclaimer
All information, articles, and product details provided on this website are for general informational and educational purposes only. We do not claim any ownership over, nor do we intend to infringe upon, any trademarks, copyrights, logos, brand names, or other intellectual property mentioned or depicted on this site. Such intellectual property remains the property of its respective owners, and any references here are made solely for identification or informational purposes, without implying any affiliation, endorsement, or partnership.
We make no representations or warranties, express or implied, regarding the accuracy, completeness, or suitability of any content or products presented. Nothing on this website should be construed as legal, tax, investment, financial, medical, or other professional advice. In addition, no part of this site—including articles or product references—constitutes a solicitation, recommendation, endorsement, advertisement, or offer to buy or sell any securities, franchises, or other financial instruments, particularly in jurisdictions where such activity would be unlawful.
All content is of a general nature and may not address the specific circumstances of any individual or entity. It is not a substitute for professional advice or services. Any actions you take based on the information provided here are strictly at your own risk. You accept full responsibility for any decisions or outcomes arising from your use of this website and agree to release us from any liability in connection with your use of, or reliance upon, the content or products found herein.