
|
Intercontinental Exchange, Inc. (ICE) DCF -Bewertung |
Fully Editable: Tailor To Your Needs In Excel Or Sheets
Professional Design: Trusted, Industry-Standard Templates
Investor-Approved Valuation Models
MAC/PC Compatible, Fully Unlocked
No Expertise Is Needed; Easy To Follow
Intercontinental Exchange, Inc. (ICE) Bundle
Entdecken Sie die finanzielle Zukunft von Intercontinental Exchange, Inc. (ICE) mit unserem benutzerfreundlichen DCF-Taschenrechner! Geben Sie Ihre Prognosen für Wachstum, Margen und Kosten ein, um den inneren Wert von Intercontinental Exchange, Inc. (ICE) zu berechnen und Ihre Anlagestrategie zu verbessern.
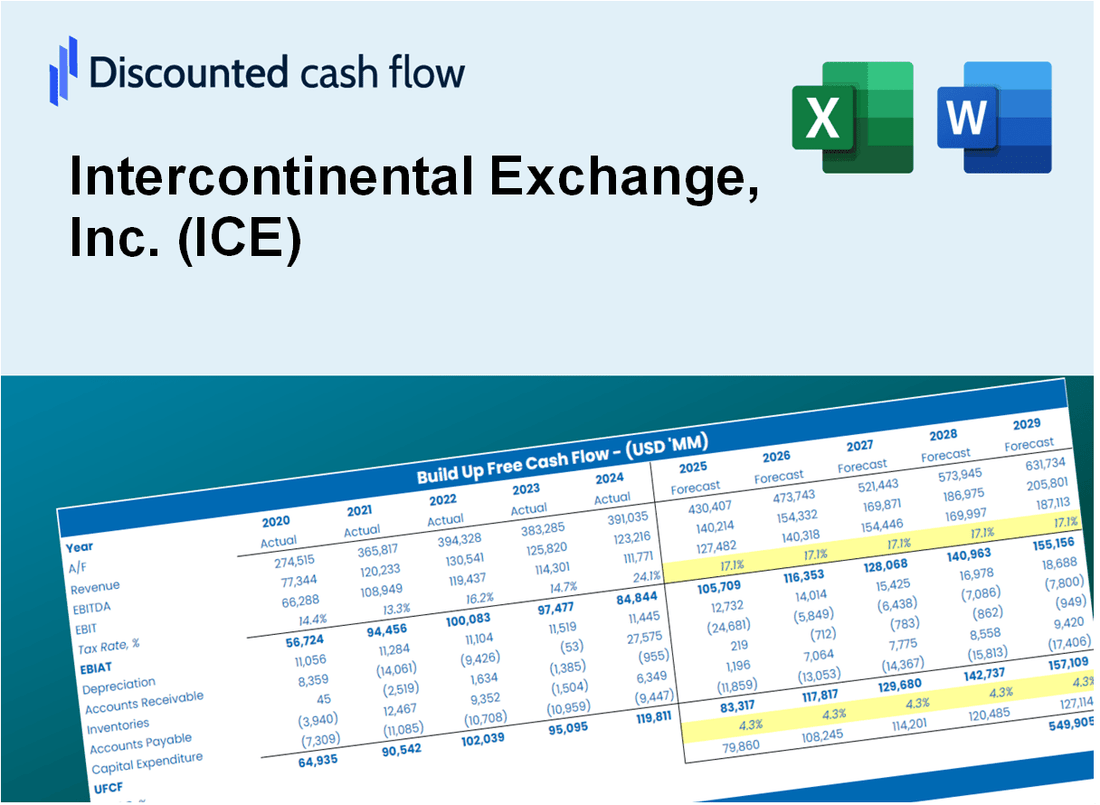
Discounted Cash Flow (DCF) - (USD MM)
| Year | AY1 2020 |
AY2 2021 |
AY3 2022 |
AY4 2023 |
AY5 2024 |
FY1 2025 |
FY2 2026 |
FY3 2027 |
FY4 2028 |
FY5 2029 |
|---|---|---|---|---|---|---|---|---|---|---|
| Revenue | 8,244.0 | 9,168.0 | 9,636.0 | 9,903.0 | 11,761.0 | 12,873.8 | 14,091.8 | 15,425.1 | 16,884.5 | 18,482.0 |
| Revenue Growth, % | 0 | 11.21 | 5.1 | 2.77 | 18.76 | 9.46 | 9.46 | 9.46 | 9.46 | 9.46 |
| EBITDA | 3,874.0 | 7,130.0 | 3,455.0 | 4,917.0 | 6,075.0 | 6,743.9 | 7,381.9 | 8,080.4 | 8,844.9 | 9,681.7 |
| EBITDA, % | 46.99 | 77.77 | 35.86 | 49.65 | 51.65 | 52.38 | 52.38 | 52.38 | 52.38 | 52.38 |
| Depreciation | 751.0 | 1,009.0 | 1,031.0 | 1,215.0 | 1,537.0 | 1,445.8 | 1,582.6 | 1,732.3 | 1,896.2 | 2,075.6 |
| Depreciation, % | 9.11 | 11.01 | 10.7 | 12.27 | 13.07 | 11.23 | 11.23 | 11.23 | 11.23 | 11.23 |
| EBIT | 3,123.0 | 6,121.0 | 2,424.0 | 3,702.0 | 4,538.0 | 5,298.1 | 5,799.3 | 6,348.1 | 6,948.7 | 7,606.1 |
| EBIT, % | 37.88 | 66.76 | 25.16 | 37.38 | 38.59 | 41.15 | 41.15 | 41.15 | 41.15 | 41.15 |
| Total Cash | 583.0 | 607.0 | 4,415.0 | 1,129.0 | 1,368.0 | 2,125.3 | 2,326.3 | 2,546.5 | 2,787.4 | 3,051.1 |
| Total Cash, percent | .0 | .0 | .0 | .0 | .0 | .0 | .0 | .0 | .0 | .0 |
| Account Receivables | 1,230.0 | 1,208.0 | 3,935.0 | 2,950.0 | 3,129.0 | 3,226.8 | 3,532.2 | 3,866.3 | 4,232.2 | 4,632.6 |
| Account Receivables, % | 14.92 | 13.18 | 40.84 | 29.79 | 26.6 | 25.07 | 25.07 | 25.07 | 25.07 | 25.07 |
| Inventories | .0 | .0 | .0 | .0 | .0 | .0 | .0 | .0 | .0 | .0 |
| Inventories, % | 0 | 0 | 0 | 0 | 0 | 0 | 0 | 0 | 0 | 0 |
| Accounts Payable | 639.0 | 703.0 | 866.0 | 1,003.0 | 1,051.0 | 1,119.3 | 1,225.2 | 1,341.1 | 1,468.0 | 1,606.9 |
| Accounts Payable, % | 7.75 | 7.67 | 8.99 | 10.13 | 8.94 | 8.69 | 8.69 | 8.69 | 8.69 | 8.69 |
| Capital Expenditure | -410.0 | -452.0 | -482.0 | -489.0 | -406.0 | -599.8 | -656.6 | -718.7 | -786.7 | -861.1 |
| Capital Expenditure, % | -4.97 | -4.93 | -5 | -4.94 | -3.45 | -4.66 | -4.66 | -4.66 | -4.66 | -4.66 |
| Tax Rate, % | 24.09 | 24.09 | 24.09 | 24.09 | 24.09 | 24.09 | 24.09 | 24.09 | 24.09 | 24.09 |
| EBITAT | 2,358.6 | 4,359.3 | 1,938.7 | 3,029.1 | 3,444.8 | 4,073.7 | 4,459.2 | 4,881.1 | 5,342.9 | 5,848.4 |
| Depreciation | ||||||||||
| Changes in Account Receivables | ||||||||||
| Changes in Inventories | ||||||||||
| Changes in Accounts Payable | ||||||||||
| Capital Expenditure | ||||||||||
| UFCF | 2,108.6 | 5,002.3 | -76.3 | 4,877.1 | 4,444.8 | 4,890.1 | 5,185.8 | 5,676.4 | 6,213.5 | 6,801.4 |
| WACC, % | 7.7 | 7.67 | 7.74 | 7.76 | 7.71 | 7.71 | 7.71 | 7.71 | 7.71 | 7.71 |
| PV UFCF | ||||||||||
| SUM PV UFCF | 22,858.1 | |||||||||
| Long Term Growth Rate, % | 2.00 | |||||||||
| Free cash flow (T + 1) | 6,937 | |||||||||
| Terminal Value | 121,410 | |||||||||
| Present Terminal Value | 83,732 | |||||||||
| Enterprise Value | 106,590 | |||||||||
| Net Debt | 19,859 | |||||||||
| Equity Value | 86,731 | |||||||||
| Diluted Shares Outstanding, MM | 576 | |||||||||
| Equity Value Per Share | 150.58 |
What You Will Get
- Editable Forecast Inputs: Easily modify assumptions (growth %, margins, WACC) to explore various scenarios.
- Real-World Data: Intercontinental Exchange, Inc. (ICE)’s financial data pre-filled to enhance your analysis.
- Automatic DCF Outputs: The template computes Net Present Value (NPV) and intrinsic value automatically.
- Customizable and Professional: A sleek Excel model that adjusts to your valuation requirements.
- Built for Analysts and Investors: Perfect for assessing projections, validating strategies, and optimizing efficiency.
Key Features
- 🔍 Real-Life ICE Financials: Pre-filled historical and projected data for Intercontinental Exchange, Inc. (ICE).
- ✏️ Fully Customizable Inputs: Adjust all critical parameters (yellow cells) like WACC, growth %, and tax rates.
- 📊 Professional DCF Valuation: Built-in formulas calculate ICE’s intrinsic value using the Discounted Cash Flow method.
- ⚡ Instant Results: Visualize ICE’s valuation instantly after making changes.
- Scenario Analysis: Test and compare outcomes for various financial assumptions side-by-side.
How It Works
- Step 1: Download the prebuilt Excel template featuring Intercontinental Exchange, Inc. (ICE) data.
- Step 2: Navigate through the pre-filled sheets to familiarize yourself with the essential metrics.
- Step 3: Modify forecasts and assumptions in the editable yellow cells (WACC, growth, margins).
- Step 4: Instantly see the recalculated results, including the intrinsic value of Intercontinental Exchange, Inc. (ICE).
- Step 5: Utilize the outputs to make informed investment decisions or create comprehensive reports.
Why Choose This Calculator?
- Accurate Data: Real Intercontinental Exchange, Inc. (ICE) financials ensure reliable valuation results.
- Customizable: Adjust key parameters like growth rates, WACC, and tax rates to match your projections.
- Time-Saving: Pre-built calculations eliminate the need to start from scratch.
- Professional-Grade Tool: Designed for investors, analysts, and consultants.
- User-Friendly: Intuitive layout and step-by-step instructions make it easy for all users.
Who Should Use This Product?
- Institutional Investors: Develop comprehensive trading strategies based on market data from Intercontinental Exchange, Inc. (ICE).
- Risk Management Teams: Assess and mitigate financial risks using advanced analytical tools offered by Intercontinental Exchange, Inc. (ICE).
- Financial Analysts: Provide clients with in-depth insights and forecasts related to market trends involving Intercontinental Exchange, Inc. (ICE).
- Students and Educators: Utilize real-time market information to enhance learning and teaching in finance and trading.
- Market Enthusiasts: Gain a deeper understanding of how exchanges like Intercontinental Exchange, Inc. (ICE) influence global markets.
What the Template Contains
- Operating and Balance Sheet Data: Pre-filled Intercontinental Exchange, Inc. (ICE) historical data and forecasts, including revenue, EBITDA, EBIT, and capital expenditures.
- WACC Calculation: A dedicated sheet for Weighted Average Cost of Capital (WACC), featuring parameters such as Beta, risk-free rate, and share price.
- DCF Valuation (Unlevered and Levered): Editable Discounted Cash Flow models illustrating intrinsic value with comprehensive calculations.
- Financial Statements: Pre-loaded financial statements (annual and quarterly) to facilitate analysis.
- Key Ratios: Includes profitability, leverage, and efficiency ratios for Intercontinental Exchange, Inc. (ICE).
- Dashboard and Charts: Visual summary of valuation outputs and assumptions to simplify result analysis.
Disclaimer
All information, articles, and product details provided on this website are for general informational and educational purposes only. We do not claim any ownership over, nor do we intend to infringe upon, any trademarks, copyrights, logos, brand names, or other intellectual property mentioned or depicted on this site. Such intellectual property remains the property of its respective owners, and any references here are made solely for identification or informational purposes, without implying any affiliation, endorsement, or partnership.
We make no representations or warranties, express or implied, regarding the accuracy, completeness, or suitability of any content or products presented. Nothing on this website should be construed as legal, tax, investment, financial, medical, or other professional advice. In addition, no part of this site—including articles or product references—constitutes a solicitation, recommendation, endorsement, advertisement, or offer to buy or sell any securities, franchises, or other financial instruments, particularly in jurisdictions where such activity would be unlawful.
All content is of a general nature and may not address the specific circumstances of any individual or entity. It is not a substitute for professional advice or services. Any actions you take based on the information provided here are strictly at your own risk. You accept full responsibility for any decisions or outcomes arising from your use of this website and agree to release us from any liability in connection with your use of, or reliance upon, the content or products found herein.