
|
ICRA Limited (ICRA.NS) DCF -Bewertung |
Fully Editable: Tailor To Your Needs In Excel Or Sheets
Professional Design: Trusted, Industry-Standard Templates
Investor-Approved Valuation Models
MAC/PC Compatible, Fully Unlocked
No Expertise Is Needed; Easy To Follow
ICRA Limited (ICRA.NS) Bundle
Optimieren Sie Ihre Zeit und steigern Sie die Präzision mit unserem ICRA Limited (ICRANS) DCF -Taschenrechner! Ausgestattet mit authentischen Daten von ICRA und anpassbaren Annahmen ermöglicht es Ihnen, ICRA Limited (ICRANS) wie ein erfahrener Investor zu prognostizieren, zu analysieren und zu bewerten.
Discounted Cash Flow (DCF) - (USD MM)
| Year | AY1 2021 |
AY2 2022 |
AY3 2023 |
AY4 2024 |
AY5 2025 |
FY1 2026 |
FY2 2027 |
FY3 2028 |
FY4 2029 |
FY5 2030 |
|---|---|---|---|---|---|---|---|---|---|---|
| Revenue | 3,010.6 | 3,400.6 | 4,032.3 | 4,461.1 | 4,980.2 | 5,650.1 | 6,410.0 | 7,272.2 | 8,250.3 | 9,359.9 |
| Revenue Growth, % | 0 | 12.95 | 18.58 | 10.64 | 11.64 | 13.45 | 13.45 | 13.45 | 13.45 | 13.45 |
| EBITDA | 1,235.5 | 1,614.6 | 1,924.6 | 2,237.3 | 2,551.7 | 2,685.3 | 3,046.5 | 3,456.2 | 3,921.1 | 4,448.5 |
| EBITDA, % | 41.04 | 47.48 | 47.73 | 50.15 | 51.24 | 47.53 | 47.53 | 47.53 | 47.53 | 47.53 |
| Depreciation | 94.8 | 78.1 | 98.3 | 134.6 | 163.9 | 160.4 | 182.0 | 206.5 | 234.2 | 265.7 |
| Depreciation, % | 3.15 | 2.3 | 2.44 | 3.02 | 3.29 | 2.84 | 2.84 | 2.84 | 2.84 | 2.84 |
| EBIT | 1,140.6 | 1,536.5 | 1,826.3 | 2,102.7 | 2,387.7 | 2,524.9 | 2,864.5 | 3,249.8 | 3,686.9 | 4,182.8 |
| EBIT, % | 37.89 | 45.18 | 45.29 | 47.13 | 47.94 | 44.69 | 44.69 | 44.69 | 44.69 | 44.69 |
| Total Cash | 4,167.4 | 3,703.1 | 5,032.8 | 5,754.9 | 10,530.3 | 5,650.1 | 6,410.0 | 7,272.2 | 8,250.3 | 9,359.9 |
| Total Cash, percent | .0 | .0 | .0 | .0 | .0 | .0 | .0 | .0 | .0 | .0 |
| Account Receivables | 646.2 | 460.6 | 409.8 | 549.9 | 476.0 | 757.7 | 859.6 | 975.3 | 1,106.4 | 1,255.3 |
| Account Receivables, % | 21.46 | 13.54 | 10.16 | 12.33 | 9.56 | 13.41 | 13.41 | 13.41 | 13.41 | 13.41 |
| Inventories | .0 | 184.5 | .0 | .0 | .0 | 61.3 | 69.5 | 78.9 | 89.5 | 101.5 |
| Inventories, % | 0 | 5.42 | 0 | 0 | 0 | 1.08 | 1.08 | 1.08 | 1.08 | 1.08 |
| Accounts Payable | 78.0 | 83.8 | 83.8 | 74.8 | 91.1 | 120.3 | 136.5 | 154.8 | 175.6 | 199.2 |
| Accounts Payable, % | 2.59 | 2.47 | 2.08 | 1.68 | 1.83 | 2.13 | 2.13 | 2.13 | 2.13 | 2.13 |
| Capital Expenditure | -35.1 | -52.2 | -90.9 | -69.0 | -124.1 | -101.6 | -115.3 | -130.8 | -148.4 | -168.4 |
| Capital Expenditure, % | -1.17 | -1.54 | -2.25 | -1.55 | -2.49 | -1.8 | -1.8 | -1.8 | -1.8 | -1.8 |
| Tax Rate, % | 27.34 | 27.34 | 27.34 | 27.34 | 27.34 | 27.34 | 27.34 | 27.34 | 27.34 | 27.34 |
| EBITAT | 831.6 | 1,134.4 | 1,362.9 | 1,589.6 | 1,735.0 | 1,866.6 | 2,117.6 | 2,402.4 | 2,725.6 | 3,092.2 |
| Depreciation | ||||||||||
| Changes in Account Receivables | ||||||||||
| Changes in Inventories | ||||||||||
| Changes in Accounts Payable | ||||||||||
| Capital Expenditure | ||||||||||
| UFCF | 323.1 | 1,167.3 | 1,605.6 | 1,506.2 | 1,865.0 | 1,611.4 | 2,090.3 | 2,371.4 | 2,690.4 | 3,052.3 |
| WACC, % | 4.73 | 4.73 | 4.73 | 4.73 | 4.73 | 4.73 | 4.73 | 4.73 | 4.73 | 4.73 |
| PV UFCF | ||||||||||
| SUM PV UFCF | 10,166.9 | |||||||||
| Long Term Growth Rate, % | 2.00 | |||||||||
| Free cash flow (T + 1) | 3,113 | |||||||||
| Terminal Value | 113,939 | |||||||||
| Present Terminal Value | 90,421 | |||||||||
| Enterprise Value | 100,587 | |||||||||
| Net Debt | -2,684 | |||||||||
| Equity Value | 103,271 | |||||||||
| Diluted Shares Outstanding, MM | 10 | |||||||||
| Equity Value Per Share | 10,719.53 |
What You Will Receive
- Customizable Excel Template: A fully editable Excel-based DCF Calculator featuring preloaded real ICRA Limited (ICRANS) financial data.
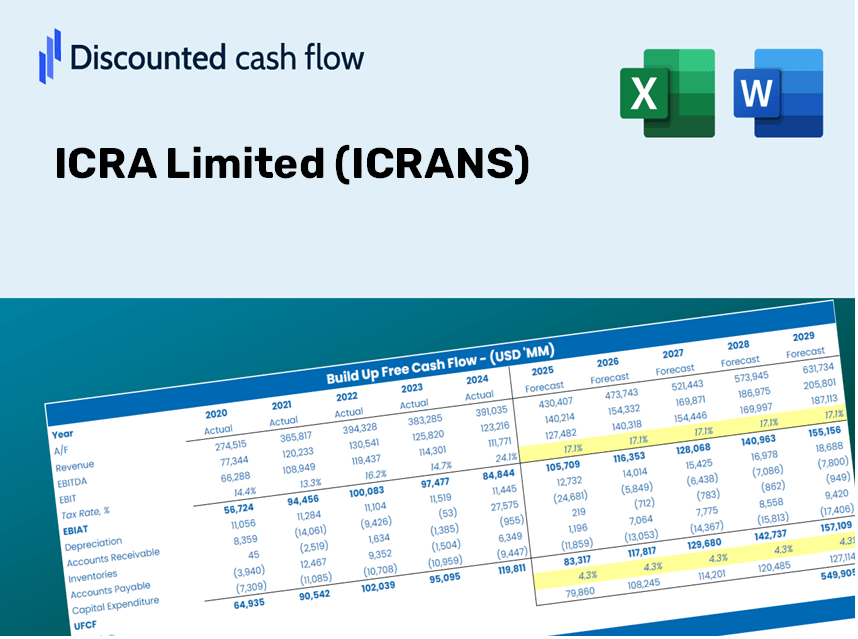
- Comprehensive Data: Access historical data and future projections (highlighted in the yellow cells).
- Flexible Forecasting: Adjust key assumptions such as revenue growth, EBITDA margin, and WACC.
- Instant Calculations: Quickly observe how your inputs affect the valuation of ICRA Limited (ICRANS).
- Professional Resource: Designed for investors, CFOs, consultants, and financial analysts.
- User-Friendly Interface: Organized for ease of understanding and navigation, complete with step-by-step guidance.
Key Features
- Authentic ICRA Limited Financial Data: Gain access to precise historical data and forward-looking projections tailored for ICRANS (ICRA Limited).
- Personalizable Forecast Variables: Modify highlighted cells, including WACC, growth rates, and profit margins to suit your analysis.
- Real-Time Calculations: Automatic updates for DCF, Net Present Value (NPV), and cash flow evaluations.
- Interactive Visual Dashboard: Clear and accessible charts that present your valuation findings effectively.
- Designed for All Skill Levels: An intuitive layout created for investors, CFOs, and consultants alike.
How It Works
- 1. Download the Template: Obtain and open the Excel file featuring ICRA Limited's (ICRANS) predefined data.
- 2. Modify Inputs: Update essential assumptions such as growth rates, WACC, and capital expenditures.
- 3. View Results in Real-Time: The DCF model automatically computes the intrinsic value and NPV.
- 4. Explore Different Scenarios: Analyze various forecasts to understand different valuation possibilities.
- 5. Present with Assurance: Deliver professional valuation insights to bolster your decision-making process.
Why Choose the ICRA Limited (ICRANS) Calculator?
- Precise Information: Utilizing genuine ICRA Limited financials for dependable valuation outcomes.
- Flexible Settings: Modify essential parameters such as growth rates, WACC, and tax rates to align with your forecasts.
- Efficient: Pre-configured calculations save you the effort of starting from scratch.
- Professional-Quality Tool: Tailored for investors, analysts, and consultants alike.
- Easy to Use: User-friendly design and straightforward instructions cater to all skill levels.
Who Can Benefit from ICRA Limited (ICRANS)?
- Investment Professionals: Develop comprehensive and accurate valuation models for portfolio assessment.
- Corporate Finance Teams: Evaluate valuation scenarios to inform strategic decisions within the organization.
- Consultants and Advisors: Deliver precise valuation insights to clients regarding ICRA Limited's (ICRANS) stock.
- Students and Educators: Utilize real-time data for practical exercises and teaching financial modeling techniques.
- Market Analysts: Gain insights into how companies like ICRA Limited (ICRANS) are valued in the financial landscape.
What the Template Includes
- Preloaded ICRA Limited (ICRANS) Data: Historical and projected financial metrics, including revenue, EBIT, and capital expenditures.
- DCF and WACC Models: Advanced spreadsheets designed for determining intrinsic value and calculating Weighted Average Cost of Capital.
- Editable Inputs: Yellow-highlighted cells for modifying revenue growth assumptions, tax rates, and discount rates.
- Financial Statements: Detailed annual and quarterly financial reports for thorough analysis.
- Key Ratios: Metrics for profitability, leverage, and efficiency to assess performance.
- Dashboard and Charts: Visual representations of valuation results and underlying assumptions.
Disclaimer
All information, articles, and product details provided on this website are for general informational and educational purposes only. We do not claim any ownership over, nor do we intend to infringe upon, any trademarks, copyrights, logos, brand names, or other intellectual property mentioned or depicted on this site. Such intellectual property remains the property of its respective owners, and any references here are made solely for identification or informational purposes, without implying any affiliation, endorsement, or partnership.
We make no representations or warranties, express or implied, regarding the accuracy, completeness, or suitability of any content or products presented. Nothing on this website should be construed as legal, tax, investment, financial, medical, or other professional advice. In addition, no part of this site—including articles or product references—constitutes a solicitation, recommendation, endorsement, advertisement, or offer to buy or sell any securities, franchises, or other financial instruments, particularly in jurisdictions where such activity would be unlawful.
All content is of a general nature and may not address the specific circumstances of any individual or entity. It is not a substitute for professional advice or services. Any actions you take based on the information provided here are strictly at your own risk. You accept full responsibility for any decisions or outcomes arising from your use of this website and agree to release us from any liability in connection with your use of, or reliance upon, the content or products found herein.