
|
IDEXX Laboratories, Inc. (IDXX) DCF -Bewertung |
Fully Editable: Tailor To Your Needs In Excel Or Sheets
Professional Design: Trusted, Industry-Standard Templates
Investor-Approved Valuation Models
MAC/PC Compatible, Fully Unlocked
No Expertise Is Needed; Easy To Follow
IDEXX Laboratories, Inc. (IDXX) Bundle
Gewinnen Sie einen Einblick in Ihre IDXX -Bewertungsanalyse (IDXX) IDXX Laboratories, Inc. (IDXX) mit unserem ausgefeilten DCF -Taschenrechner! Diese Excel -Vorlage wird mit authentischen (idxx) Daten vorinstalliert, sodass Sie Prognosen und Annahmen anpassen können, um den inneren Wert von IDEXX Laboratories, Inc.
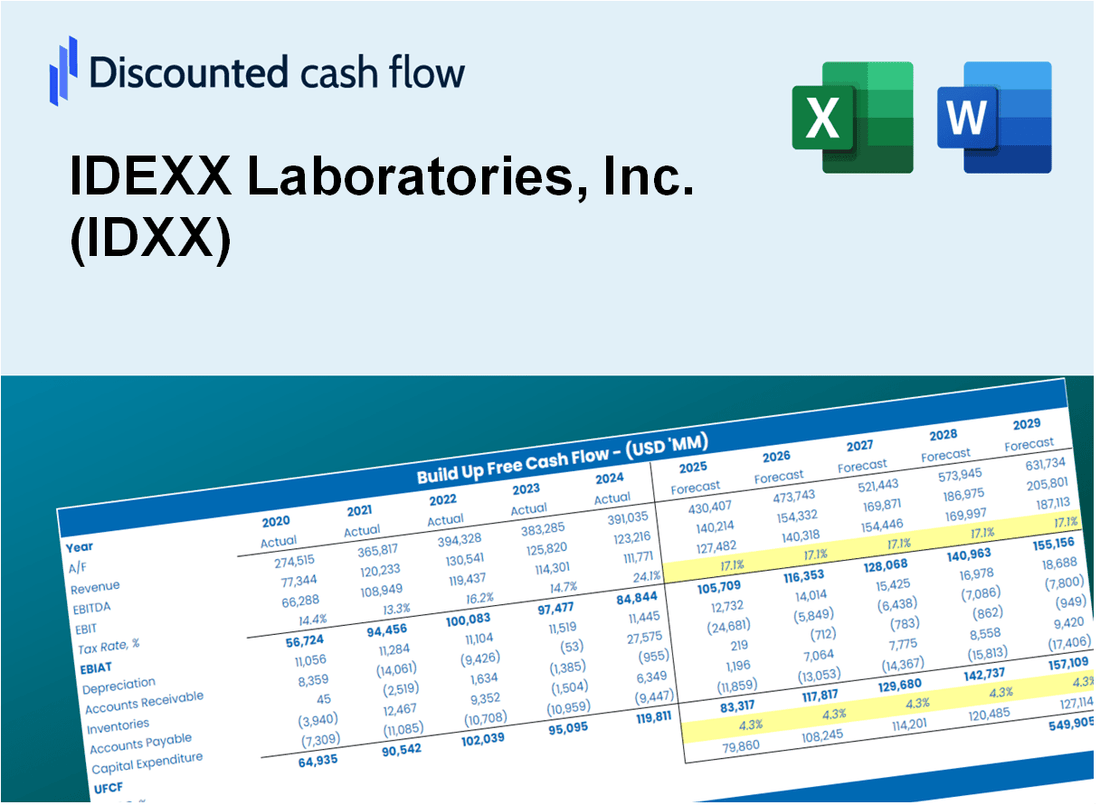
Discounted Cash Flow (DCF) - (USD MM)
| Year | AY1 2020 |
AY2 2021 |
AY3 2022 |
AY4 2023 |
AY5 2024 |
FY1 2025 |
FY2 2026 |
FY3 2027 |
FY4 2028 |
FY5 2029 |
|---|---|---|---|---|---|---|---|---|---|---|
| Revenue | 2,706.7 | 3,215.4 | 3,367.3 | 3,661.0 | 3,897.5 | 4,274.6 | 4,688.2 | 5,141.8 | 5,639.3 | 6,184.9 |
| Revenue Growth, % | 0 | 18.79 | 4.73 | 8.72 | 6.46 | 9.68 | 9.68 | 9.68 | 9.68 | 9.68 |
| EBITDA | 793.8 | 1,039.9 | 1,014.5 | 1,217.7 | 1,275.8 | 1,349.0 | 1,479.5 | 1,622.7 | 1,779.7 | 1,951.9 |
| EBITDA, % | 29.33 | 32.34 | 30.13 | 33.26 | 32.73 | 31.56 | 31.56 | 31.56 | 31.56 | 31.56 |
| Depreciation | 96.0 | 104.6 | 111.9 | 114.9 | 129.9 | 141.9 | 155.6 | 170.7 | 187.2 | 205.3 |
| Depreciation, % | 3.55 | 3.25 | 3.32 | 3.14 | 3.33 | 3.32 | 3.32 | 3.32 | 3.32 | 3.32 |
| EBIT | 697.8 | 935.3 | 902.6 | 1,102.8 | 1,145.9 | 1,207.1 | 1,323.9 | 1,452.0 | 1,592.5 | 1,746.6 |
| EBIT, % | 25.78 | 29.09 | 26.81 | 30.12 | 29.4 | 28.24 | 28.24 | 28.24 | 28.24 | 28.24 |
| Total Cash | 383.9 | 144.5 | 112.5 | 453.9 | 288.3 | 357.5 | 392.1 | 430.0 | 471.6 | 517.2 |
| Total Cash, percent | .0 | .0 | .0 | .0 | .0 | .0 | .0 | .0 | .0 | .0 |
| Account Receivables | 374.7 | 425.6 | 490.9 | 529.5 | 561.3 | 602.9 | 661.3 | 725.3 | 795.4 | 872.4 |
| Account Receivables, % | 13.85 | 13.24 | 14.58 | 14.46 | 14.4 | 14.11 | 14.11 | 14.11 | 14.11 | 14.11 |
| Inventories | 209.9 | 269.0 | 367.8 | 380.3 | 381.9 | 403.8 | 442.8 | 485.7 | 532.7 | 584.2 |
| Inventories, % | 7.75 | 8.37 | 10.92 | 10.39 | 9.8 | 9.45 | 9.45 | 9.45 | 9.45 | 9.45 |
| Accounts Payable | 74.6 | 116.1 | 110.2 | 110.6 | 114.2 | 133.3 | 146.2 | 160.3 | 175.9 | 192.9 |
| Accounts Payable, % | 2.75 | 3.61 | 3.27 | 3.02 | 2.93 | 3.12 | 3.12 | 3.12 | 3.12 | 3.12 |
| Capital Expenditure | -107.6 | -119.5 | -148.8 | -133.6 | -130.9 | -163.5 | -179.3 | -196.7 | -215.7 | -236.6 |
| Capital Expenditure, % | -3.98 | -3.72 | -4.42 | -3.65 | -3.36 | -3.82 | -3.82 | -3.82 | -3.82 | -3.82 |
| Tax Rate, % | 20 | 20 | 20 | 20 | 20 | 20 | 20 | 20 | 20 | 20 |
| EBITAT | 613.3 | 771.8 | 712.8 | 878.2 | 916.7 | 987.4 | 1,083.0 | 1,187.8 | 1,302.7 | 1,428.7 |
| Depreciation | ||||||||||
| Changes in Account Receivables | ||||||||||
| Changes in Inventories | ||||||||||
| Changes in Accounts Payable | ||||||||||
| Capital Expenditure | ||||||||||
| UFCF | 91.6 | 688.4 | 505.8 | 808.8 | 885.9 | 921.4 | 974.8 | 1,069.1 | 1,172.5 | 1,286.0 |
| WACC, % | 11.56 | 11.56 | 11.55 | 11.56 | 11.56 | 11.56 | 11.56 | 11.56 | 11.56 | 11.56 |
| PV UFCF | ||||||||||
| SUM PV UFCF | 3,880.6 | |||||||||
| Long Term Growth Rate, % | 4.00 | |||||||||
| Free cash flow (T + 1) | 1,337 | |||||||||
| Terminal Value | 17,698 | |||||||||
| Present Terminal Value | 10,244 | |||||||||
| Enterprise Value | 14,124 | |||||||||
| Net Debt | 699 | |||||||||
| Equity Value | 13,426 | |||||||||
| Diluted Shares Outstanding, MM | 83 | |||||||||
| Equity Value Per Share | 161.28 |
What You Will Get
- Editable Forecast Inputs: Effortlessly modify assumptions (growth %, margins, WACC) to generate various scenarios.
- Real-World Data: IDEXX Laboratories, Inc.'s (IDXX) financial data pre-filled to kickstart your analysis.
- Automatic DCF Outputs: The template computes Net Present Value (NPV) and intrinsic value for you.
- Customizable and Professional: A refined Excel model that adjusts to your valuation requirements.
- Built for Analysts and Investors: Perfect for evaluating projections, confirming strategies, and enhancing efficiency.
Key Features
- Accurate IDEXX Financials: Gain access to reliable pre-loaded historical data and future forecasts.
- Adjustable Forecast Parameters: Modify highlighted fields for WACC, growth rates, and profit margins.
- Real-Time Calculations: Instant updates to DCF, Net Present Value (NPV), and cash flow assessments.
- Interactive Dashboard: User-friendly charts and summaries for visualizing your valuation findings.
- Suitable for All Levels: A straightforward, intuitive layout designed for investors, CFOs, and consultants alike.
How It Works
- Download the Template: Gain immediate access to the Excel-based IDXX DCF Calculator.
- Input Your Assumptions: Modify the yellow-highlighted cells for growth rates, WACC, margins, and more.
- Instant Calculations: The model automatically recalculates IDXX Laboratories’ intrinsic value.
- Test Scenarios: Explore various assumptions to assess potential valuation changes.
- Analyze and Decide: Utilize the results to inform your investment or financial analysis.
Why Choose This Calculator for IDEXX Laboratories, Inc. (IDXX)?
- Designed for Experts: A sophisticated tool utilized by veterinarians, analysts, and healthcare consultants.
- Accurate Data: IDEXX's historical and projected financials are preloaded for precise analysis.
- Flexible Scenario Analysis: Easily test various forecasts and assumptions to assess different outcomes.
- Comprehensive Outputs: Automatically calculates intrinsic value, NPV, and essential financial metrics.
- User-Friendly: Step-by-step guidance ensures a smooth experience throughout the calculation process.
Who Should Use This Product?
- Investors: Accurately assess IDEXX Laboratories, Inc.'s (IDXX) fair value prior to making investment choices.
- CFOs: Utilize a professional-grade DCF model for financial reporting and analysis tailored to IDEXX Laboratories.
- Consultants: Easily customize the template for valuation reports specific to IDEXX Laboratories' clients.
- Entrepreneurs: Acquire knowledge on financial modeling practices employed by leading companies like IDEXX Laboratories.
- Educators: Implement it as a teaching resource to illustrate valuation techniques relevant to IDEXX Laboratories.
What the Template Contains
- Historical Data: Includes IDEXX Laboratories’ past financials and baseline forecasts.
- DCF and Levered DCF Models: Detailed templates to calculate IDEXX Laboratories’ intrinsic value.
- WACC Sheet: Pre-built calculations for Weighted Average Cost of Capital.
- Editable Inputs: Modify key drivers like growth rates, EBITDA %, and CAPEX assumptions.
- Quarterly and Annual Statements: A complete breakdown of IDEXX Laboratories’ financials.
- Interactive Dashboard: Visualize valuation results and projections dynamically.
Disclaimer
All information, articles, and product details provided on this website are for general informational and educational purposes only. We do not claim any ownership over, nor do we intend to infringe upon, any trademarks, copyrights, logos, brand names, or other intellectual property mentioned or depicted on this site. Such intellectual property remains the property of its respective owners, and any references here are made solely for identification or informational purposes, without implying any affiliation, endorsement, or partnership.
We make no representations or warranties, express or implied, regarding the accuracy, completeness, or suitability of any content or products presented. Nothing on this website should be construed as legal, tax, investment, financial, medical, or other professional advice. In addition, no part of this site—including articles or product references—constitutes a solicitation, recommendation, endorsement, advertisement, or offer to buy or sell any securities, franchises, or other financial instruments, particularly in jurisdictions where such activity would be unlawful.
All content is of a general nature and may not address the specific circumstances of any individual or entity. It is not a substitute for professional advice or services. Any actions you take based on the information provided here are strictly at your own risk. You accept full responsibility for any decisions or outcomes arising from your use of this website and agree to release us from any liability in connection with your use of, or reliance upon, the content or products found herein.