
|
IDEAYA Biosciences, Inc. (IDYA) DCF -Bewertung |
Fully Editable: Tailor To Your Needs In Excel Or Sheets
Professional Design: Trusted, Industry-Standard Templates
Investor-Approved Valuation Models
MAC/PC Compatible, Fully Unlocked
No Expertise Is Needed; Easy To Follow
IDEAYA Biosciences, Inc. (IDYA) Bundle
Möchten Sie den inneren Wert von Ideaya Biosciences, Inc. bestimmen? Unser IDYA DCF-Taschenrechner integriert reale Daten mit umfangreichen Anpassungsfunktionen, sodass Sie Ihre Prognosen verfeinern und Ihre Anlagestrategien verbessern können.
What You Will Get
- Editable Excel Template: A fully customizable Excel-based DCF Calculator featuring pre-filled real IDEAYA Biosciences, Inc. (IDYA) financials.
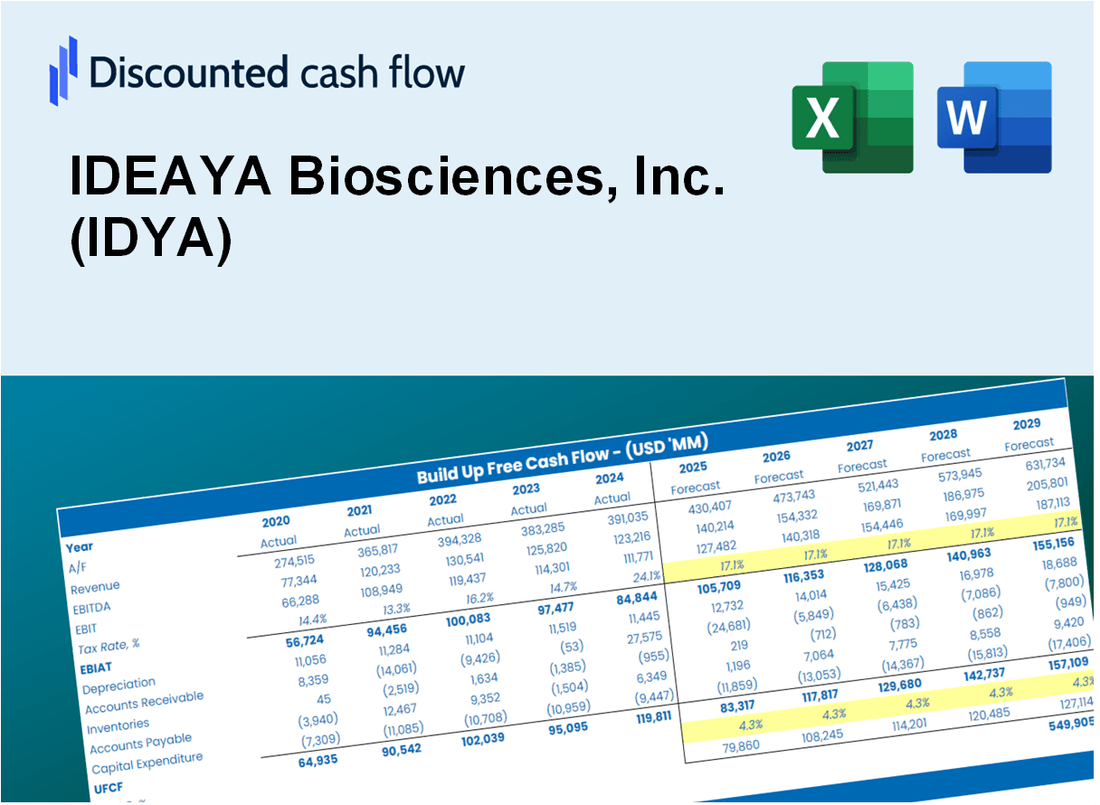
- Real-World Data: Historical data and forward-looking estimates (highlighted in the yellow cells).
- Forecast Flexibility: Adjust forecast assumptions such as revenue growth, EBITDA %, and WACC.
- Automatic Calculations: Instantly observe the effect of your inputs on IDEAYA's valuation.
- Professional Tool: Designed for investors, CFOs, consultants, and financial analysts.
- User-Friendly Design: Organized for clarity and ease of use, complete with step-by-step instructions.
Key Features
- 🔍 Real-Life IDYA Financials: Pre-filled historical and projected data for IDEAYA Biosciences, Inc. (IDYA).
- ✏️ Fully Customizable Inputs: Adjust all critical parameters (yellow cells) like WACC, growth %, and tax rates.
- 📊 Professional DCF Valuation: Built-in formulas calculate IDEAYA’s intrinsic value using the Discounted Cash Flow method.
- ⚡ Instant Results: Visualize IDEAYA’s valuation instantly after making changes.
- Scenario Analysis: Test and compare outcomes for various financial assumptions side-by-side.
How It Works
- Step 1: Download the Excel file.
- Step 2: Review pre-entered IDEAYA Biosciences data (historical and projected).
- Step 3: Adjust key assumptions (yellow cells) based on your analysis.
- Step 4: View automatic recalculations for IDEAYA Biosciences' intrinsic value.
- Step 5: Use the outputs for investment decisions or reporting.
Why Choose This Calculator for IDEAYA Biosciences, Inc. (IDYA)?
- Designed for Experts: An advanced tool tailored for biotech analysts, investors, and researchers.
- Accurate Data: IDEAYA's historical and forecasted financial information preloaded for precision.
- Flexible Scenario Analysis: Easily test various projections and assumptions.
- Comprehensive Outputs: Automatically computes intrinsic value, NPV, and essential metrics.
- User-Friendly: Step-by-step guidance simplifies the calculation process.
Who Should Use IDEAYA Biosciences, Inc. (IDYA)?
- Biotechnology Students: Explore drug development processes and apply theoretical knowledge to real-world scenarios.
- Researchers: Integrate cutting-edge research findings into academic projects or studies.
- Investors: Evaluate your investment strategies and assess the potential of IDEAYA's pipeline.
- Healthcare Analysts: Enhance your analysis with a detailed understanding of IDEAYA's clinical trials and market positioning.
- Pharmaceutical Professionals: Gain insights into the biotech landscape and how companies like IDEAYA operate within it.
What the Template Contains
- Preloaded IDYA Data: Historical and projected financial data, including revenue, EBIT, and research and development expenditures.
- DCF and WACC Models: Professional-grade sheets for calculating intrinsic value and Weighted Average Cost of Capital.
- Editable Inputs: Yellow-highlighted cells for adjusting revenue growth, tax rates, and discount rates.
- Financial Statements: Comprehensive annual and quarterly financials for deeper analysis.
- Key Ratios: Profitability, leverage, and efficiency ratios to evaluate performance.
- Dashboard and Charts: Visual summaries of valuation outcomes and assumptions.
Disclaimer
All information, articles, and product details provided on this website are for general informational and educational purposes only. We do not claim any ownership over, nor do we intend to infringe upon, any trademarks, copyrights, logos, brand names, or other intellectual property mentioned or depicted on this site. Such intellectual property remains the property of its respective owners, and any references here are made solely for identification or informational purposes, without implying any affiliation, endorsement, or partnership.
We make no representations or warranties, express or implied, regarding the accuracy, completeness, or suitability of any content or products presented. Nothing on this website should be construed as legal, tax, investment, financial, medical, or other professional advice. In addition, no part of this site—including articles or product references—constitutes a solicitation, recommendation, endorsement, advertisement, or offer to buy or sell any securities, franchises, or other financial instruments, particularly in jurisdictions where such activity would be unlawful.
All content is of a general nature and may not address the specific circumstances of any individual or entity. It is not a substitute for professional advice or services. Any actions you take based on the information provided here are strictly at your own risk. You accept full responsibility for any decisions or outcomes arising from your use of this website and agree to release us from any liability in connection with your use of, or reliance upon, the content or products found herein.