
|
Ivanhoe Electric Inc. (dh) DCF -Bewertung |
Fully Editable: Tailor To Your Needs In Excel Or Sheets
Professional Design: Trusted, Industry-Standard Templates
Investor-Approved Valuation Models
MAC/PC Compatible, Fully Unlocked
No Expertise Is Needed; Easy To Follow
Ivanhoe Electric Inc. (IE) Bundle
Verbessern Sie Ihre Anlagestrategien mit dem DCF -Taschenrechner von Ivanhoe Electric Inc. (IE)! Verwenden Sie authentische Finanzdaten, passen Sie Wachstumsprognosen und -kosten an und beobachten Sie sofort, wie sich diese Modifikationen auf den inneren Wert von Ivanhoe Electric Inc. (dh) auswirken.
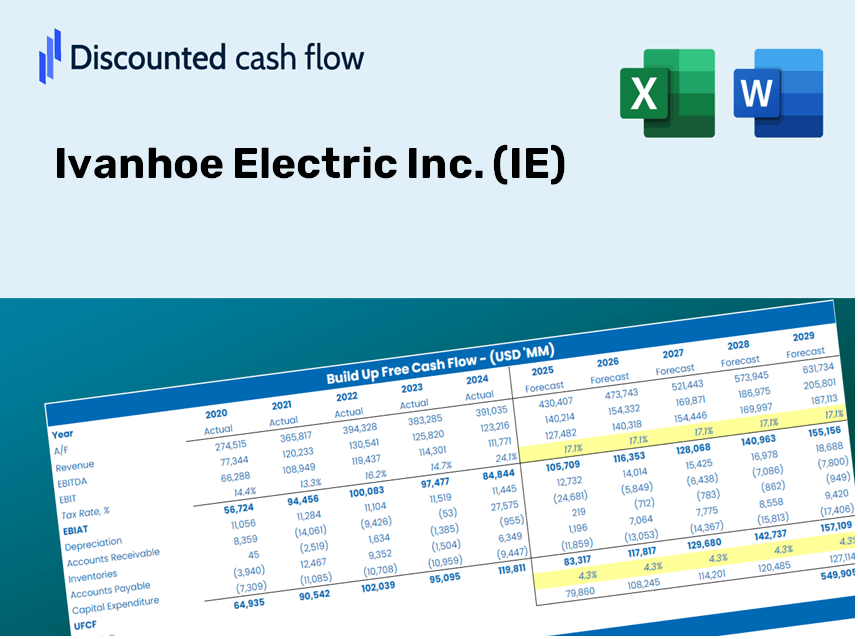
Discounted Cash Flow (DCF) - (USD MM)
| Year | AY1 2020 |
AY2 2021 |
AY3 2022 |
AY4 2023 |
AY5 2024 |
FY1 2025 |
FY2 2026 |
FY3 2027 |
FY4 2028 |
FY5 2029 |
|---|---|---|---|---|---|---|---|---|---|---|
| Revenue | 4.6 | 4.7 | 8.4 | 3.9 | 2.9 | 2.9 | 2.9 | 3.0 | 3.0 | 3.0 |
| Revenue Growth, % | 0 | 0.4101 | 81.43 | -53.76 | -25.67 | 0.60224 | 0.60224 | 0.60224 | 0.60224 | 0.60224 |
| EBITDA | -25.3 | -62.2 | -154.4 | -211.1 | -135.0 | -2.9 | -2.9 | -3.0 | -3.0 | -3.0 |
| EBITDA, % | -545.13 | -1337.98 | -1829.62 | -5407.61 | -4651.84 | -100 | -100 | -100 | -100 | -100 |
| Depreciation | 4.0 | 4.3 | 4.2 | 2.6 | 2.7 | 2.3 | 2.3 | 2.3 | 2.3 | 2.3 |
| Depreciation, % | 87.2 | 91.36 | 49.89 | 67.64 | 93.17 | 77.85 | 77.85 | 77.85 | 77.85 | 77.85 |
| EBIT | -29.3 | -66.5 | -158.6 | -213.7 | -137.7 | -2.9 | -2.9 | -3.0 | -3.0 | -3.0 |
| EBIT, % | -632.33 | -1429.34 | -1879.51 | -5475.25 | -4745.02 | -100 | -100 | -100 | -100 | -100 |
| Total Cash | 9.3 | 49.9 | 139.7 | 205.0 | 41.0 | 2.9 | 2.9 | 3.0 | 3.0 | 3.0 |
| Total Cash, percent | .0 | .0 | .0 | .0 | .0 | .0 | .0 | .0 | .0 | .0 |
| Account Receivables | 2.8 | 1.4 | 1.5 | 3.3 | 21.6 | 1.7 | 1.7 | 1.7 | 1.7 | 1.8 |
| Account Receivables, % | 61.32 | 29.77 | 17.74 | 85.22 | 743.5 | 58.81 | 58.81 | 58.81 | 58.81 | 58.81 |
| Inventories | 3.5 | 5.9 | 5.6 | 5.0 | .0 | 2.0 | 2.0 | 2.0 | 2.0 | 2.1 |
| Inventories, % | 76.37 | 126.35 | 66.92 | 128.44 | 0 | 68.66 | 68.66 | 68.66 | 68.66 | 68.66 |
| Accounts Payable | 1.3 | 5.7 | 4.6 | 12.9 | 6.3 | 2.2 | 2.2 | 2.3 | 2.3 | 2.3 |
| Accounts Payable, % | 28.47 | 122.98 | 54.24 | 329.46 | 217.48 | 76.54 | 76.54 | 76.54 | 76.54 | 76.54 |
| Capital Expenditure | -16.7 | -18.4 | -44.4 | -82.1 | -13.6 | -2.9 | -2.9 | -3.0 | -3.0 | -3.0 |
| Capital Expenditure, % | -361.02 | -395.36 | -526.2 | -2103.13 | -467.77 | -100 | -100 | -100 | -100 | -100 |
| Tax Rate, % | 8.28 | 8.28 | 8.28 | 8.28 | 8.28 | 8.28 | 8.28 | 8.28 | 8.28 | 8.28 |
| EBITAT | -25.1 | -58.0 | -148.9 | -196.7 | -126.3 | -2.6 | -2.6 | -2.7 | -2.7 | -2.7 |
| Depreciation | ||||||||||
| Changes in Account Receivables | ||||||||||
| Changes in Inventories | ||||||||||
| Changes in Accounts Payable | ||||||||||
| Capital Expenditure | ||||||||||
| UFCF | -42.8 | -68.6 | -190.1 | -269.0 | -156.9 | 10.5 | -3.3 | -3.3 | -3.3 | -3.4 |
| WACC, % | 8.22 | 8.22 | 8.23 | 8.23 | 8.22 | 8.22 | 8.22 | 8.22 | 8.22 | 8.22 |
| PV UFCF | ||||||||||
| SUM PV UFCF | -.4 | |||||||||
| Long Term Growth Rate, % | 2.00 | |||||||||
| Free cash flow (T + 1) | -3 | |||||||||
| Terminal Value | -55 | |||||||||
| Present Terminal Value | -37 | |||||||||
| Enterprise Value | -38 | |||||||||
| Net Debt | 29 | |||||||||
| Equity Value | -66 | |||||||||
| Diluted Shares Outstanding, MM | 120 | |||||||||
| Equity Value Per Share | -0.55 |
What You Will Receive
- Adjustable Forecast Variables: Easily modify key assumptions (growth %, profit margins, WACC) to generate various scenarios.
- Real-Time Financial Data: Ivanhoe Electric Inc. (IE) financial data pre-loaded to enhance your analysis.
- Automated DCF Calculations: This template computes Net Present Value (NPV) and intrinsic value for you seamlessly.
- Customizable and Professional Design: A refined Excel model tailored to your valuation requirements.
- Designed for Analysts and Investors: Perfect for testing forecasts, confirming strategies, and optimizing your time.
Key Features
- Pre-Loaded Data: Ivanhoe Electric Inc.'s (IE) historical financial statements and pre-filled forecasts.
- Fully Adjustable Inputs: Modify WACC, tax rates, revenue growth, and EBITDA margins as needed.
- Instant Results: Monitor the recalculation of Ivanhoe Electric Inc.'s (IE) intrinsic value in real time.
- Clear Visual Outputs: Dashboard charts showcase valuation results and essential metrics.
- Built for Accuracy: A professional tool designed for analysts, investors, and finance professionals.
How It Operates
- Download the Template: Gain immediate access to the Excel-based IE DCF Calculator.
- Input Your Assumptions: Modify the yellow-highlighted cells for growth rates, WACC, margins, and additional parameters.
- Instant Calculations: The model automatically refreshes Ivanhoe Electric Inc.’s intrinsic value.
- Test Scenarios: Experiment with various assumptions to assess possible valuation shifts.
- Analyze and Decide: Utilize the findings to inform your investment or financial evaluations.
Why Choose the Ivanhoe Electric Inc. (IE) Calculator?
- Reliable Financial Data: Access authentic Ivanhoe Electric financial information for dependable valuation outcomes.
- Flexible and Customizable: Modify essential inputs such as growth projections, WACC, and tax rates to fit your analysis.
- Efficient and Time-Saving: Built-in calculations streamline your workflow, so you don’t have to start from the ground up.
- Professional-Quality Tool: Crafted specifically for investors, analysts, and consultants in the field.
- User-Friendly Interface: Designed with an intuitive format and clear instructions to assist users of all experience levels.
Who Can Benefit from Ivanhoe Electric Inc. (IE)?
- Investors: Empower your investment choices with a professional-grade evaluation tool tailored for Ivanhoe Electric Inc. (IE).
- Financial Analysts: Streamline your analysis process with a customizable discounted cash flow (DCF) model designed specifically for Ivanhoe Electric Inc. (IE).
- Consultants: Easily modify the template for client presentations or reports focused on Ivanhoe Electric Inc. (IE).
- Finance Enthusiasts: Enhance your knowledge of valuation methods by exploring real-world applications related to Ivanhoe Electric Inc. (IE).
- Educators and Students: Leverage this tool as a hands-on resource in finance courses emphasizing Ivanhoe Electric Inc. (IE).
Contents of the Template
- Pre-Filled DCF Model: Ivanhoe Electric Inc.'s (IE) financial data ready for immediate application.
- WACC Calculator: Comprehensive calculations for the Weighted Average Cost of Capital.
- Financial Ratios: Assess Ivanhoe Electric Inc.'s (IE) profitability, leverage, and operational efficiency.
- Editable Inputs: Modify parameters such as growth rates, profit margins, and capital expenditures to tailor your analysis.
- Financial Statements: Access annual and quarterly reports for in-depth evaluation.
- Interactive Dashboard: Effortlessly visualize essential valuation metrics and outcomes.
Disclaimer
All information, articles, and product details provided on this website are for general informational and educational purposes only. We do not claim any ownership over, nor do we intend to infringe upon, any trademarks, copyrights, logos, brand names, or other intellectual property mentioned or depicted on this site. Such intellectual property remains the property of its respective owners, and any references here are made solely for identification or informational purposes, without implying any affiliation, endorsement, or partnership.
We make no representations or warranties, express or implied, regarding the accuracy, completeness, or suitability of any content or products presented. Nothing on this website should be construed as legal, tax, investment, financial, medical, or other professional advice. In addition, no part of this site—including articles or product references—constitutes a solicitation, recommendation, endorsement, advertisement, or offer to buy or sell any securities, franchises, or other financial instruments, particularly in jurisdictions where such activity would be unlawful.
All content is of a general nature and may not address the specific circumstances of any individual or entity. It is not a substitute for professional advice or services. Any actions you take based on the information provided here are strictly at your own risk. You accept full responsibility for any decisions or outcomes arising from your use of this website and agree to release us from any liability in connection with your use of, or reliance upon, the content or products found herein.