
|
Inflarx N.V. (IFRX) DCF -Bewertung |
Fully Editable: Tailor To Your Needs In Excel Or Sheets
Professional Design: Trusted, Industry-Standard Templates
Investor-Approved Valuation Models
MAC/PC Compatible, Fully Unlocked
No Expertise Is Needed; Easy To Follow
InflaRx N.V. (IFRX) Bundle
Erforschen Sie die finanziellen Aussichten in Inflarx N.V. (IFRX) mit unserem benutzerfreundlichen DCF-Taschenrechner! Geben Sie Ihre Vorhersagen für Wachstum, Margen und Kosten ein, um den inneren Wert von Inflarx N.V. (IFRX) zu bestimmen und formen Sie Ihren Investitionsansatz.
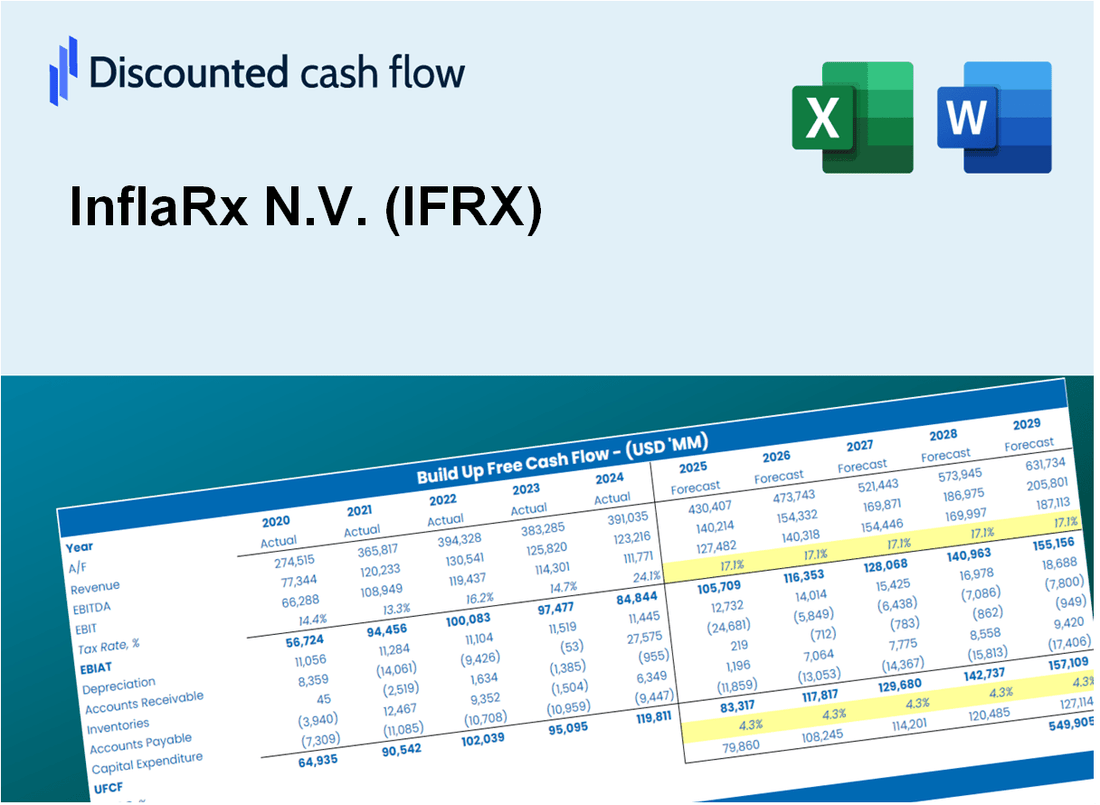
Discounted Cash Flow (DCF) - (USD MM)
| Year | AY1 2020 |
AY2 2021 |
AY3 2022 |
AY4 2023 |
AY5 2024 |
FY1 2025 |
FY2 2026 |
FY3 2027 |
FY4 2028 |
FY5 2029 |
|---|---|---|---|---|---|---|---|---|---|---|
| Revenue | .0 | .0 | .0 | .1 | .2 | .2 | .3 | .4 | .5 | .6 |
| Revenue Growth, % | 0 | 0 | 0 | 0 | 162.79 | 25 | 25 | 25 | 25 | 25 |
| EBITDA | -38.6 | -52.1 | -33.5 | -48.8 | -52.8 | .0 | .1 | .1 | .1 | .1 |
| EBITDA, % | 100 | 100 | 100 | -66674.26 | -27476.74 | 20 | 20 | 20 | 20 | 20 |
| Depreciation | .8 | .8 | .7 | .7 | .6 | .2 | .3 | .4 | .5 | .6 |
| Depreciation, % | 100 | 100 | 100 | 899.97 | 292.61 | 100 | 100 | 100 | 100 | 100 |
| EBIT | -39.4 | -52.9 | -34.1 | -49.4 | -53.4 | .0 | .1 | .1 | .1 | .1 |
| EBIT, % | 100 | 100 | 100 | -67574.22 | -27769.35 | 20 | 20 | 20 | 20 | 20 |
| Total Cash | 94.1 | 96.7 | 94.9 | 14.8 | 21.3 | .2 | .3 | .4 | .5 | .6 |
| Total Cash, percent | .0 | .0 | .0 | .0 | .0 | .0 | .0 | .0 | .0 | .0 |
| Account Receivables | .0 | 1.5 | 1.7 | .0 | .0 | .1 | .2 | .2 | .3 | .4 |
| Account Receivables, % | 100 | 100 | 100 | 0 | 0 | 60 | 60 | 60 | 60 | 60 |
| Inventories | .0 | .0 | .0 | 13.2 | 8.0 | .2 | .3 | .4 | .5 | .6 |
| Inventories, % | 100 | 100 | 100 | 18018.68 | 4160.51 | 100 | 100 | 100 | 100 | 100 |
| Accounts Payable | 2.0 | 2.0 | 5.8 | 5.9 | 4.0 | .2 | .3 | .4 | .5 | .6 |
| Accounts Payable, % | 100 | 100 | 100 | 8088.1 | 2058.68 | 100 | 100 | 100 | 100 | 100 |
| Capital Expenditure | -.1 | .0 | -.2 | -.1 | -.1 | -.1 | -.1 | -.1 | -.1 | -.2 |
| Capital Expenditure, % | 100 | 100 | 100 | -128.55 | -28.27 | -25.65 | -25.65 | -25.65 | -25.65 | -25.65 |
| Tax Rate, % | -0.01132456 | -0.01132456 | -0.01132456 | -0.01132456 | -0.01132456 | -0.01132456 | -0.01132456 | -0.01132456 | -0.01132456 | -0.01132456 |
| EBITAT | -39.4 | -52.9 | -31.3 | -49.4 | -53.4 | .0 | .1 | .1 | .1 | .1 |
| Depreciation | ||||||||||
| Changes in Account Receivables | ||||||||||
| Changes in Inventories | ||||||||||
| Changes in Accounts Payable | ||||||||||
| Capital Expenditure | ||||||||||
| UFCF | -36.7 | -53.7 | -27.2 | -60.3 | -49.7 | 4.1 | .2 | .3 | .4 | .5 |
| WACC, % | 10.55 | 10.55 | 10.54 | 10.55 | 10.55 | 10.55 | 10.55 | 10.55 | 10.55 | 10.55 |
| PV UFCF | ||||||||||
| SUM PV UFCF | 4.7 | |||||||||
| Long Term Growth Rate, % | 2.00 | |||||||||
| Free cash flow (T + 1) | 0 | |||||||||
| Terminal Value | 6 | |||||||||
| Present Terminal Value | 3 | |||||||||
| Enterprise Value | 8 | |||||||||
| Net Debt | -20 | |||||||||
| Equity Value | 29 | |||||||||
| Diluted Shares Outstanding, MM | 59 | |||||||||
| Equity Value Per Share | 0.48 |
What You Will Receive
- Authentic IFRX Financial Data: Pre-loaded with InflaRx N.V.’s historical and projected figures for accurate analysis.
- Completely Customizable Template: Easily adjust key inputs such as revenue growth, WACC, and EBITDA %.
- Instant Calculations: Watch as InflaRx N.V.’s intrinsic value updates in real-time according to your modifications.
- Expert Valuation Tool: Tailored for investors, analysts, and consultants aiming for precise DCF outcomes.
- Intuitive Design: Streamlined layout and straightforward instructions suitable for all skill levels.
Key Features
- Comprehensive Financial Data: Gain access to precise pre-loaded historical financials and future forecasts for InflaRx N.V. (IFRX).
- Adjustable Forecast Parameters: Modify highlighted cells for key metrics such as WACC, growth rates, and profit margins.
- Real-Time Calculations: Enjoy automatic updates for DCF, Net Present Value (NPV), and cash flow evaluations.
- User-Friendly Dashboard: View clear charts and summaries to effectively interpret your valuation findings.
- Designed for All Skill Levels: A straightforward, intuitive layout tailored for investors, CFOs, and consultants alike.
How It Works
- 1. Access the Model: Download and open the Excel file containing InflaRx N.V.'s (IFRX) financial data.
- 2. Adjust Inputs: Modify essential variables such as revenue growth, discount rates, and operating expenses.
- 3. Analyze Results: The DCF model automatically computes the intrinsic value and net present value (NPV).
- 4. Explore Scenarios: Evaluate various projections to understand different valuation possibilities.
- 5. Make Informed Decisions: Share detailed valuation analysis to enhance your investment strategies.
Why Choose InflaRx N.V. (IFRX)?
- Innovative Solutions: Cutting-edge therapies developed for serious inflammatory diseases.
- Proven Track Record: Backed by robust clinical data demonstrating efficacy and safety.
- Dedicated Team: Experienced professionals committed to advancing patient care.
- Strong Pipeline: A diverse range of candidates in various stages of development.
- Collaborative Approach: Partnerships with leading institutions to enhance research and development.
Who Should Use This Product?
- Investors: Evaluate InflaRx N.V. (IFRX) for informed stock trading decisions.
- CFOs and Financial Analysts: Optimize valuation assessments and validate financial forecasts.
- Biotech Entrepreneurs: Understand the valuation methods applied to companies like InflaRx N.V. (IFRX).
- Consultants: Provide comprehensive valuation analyses and reports for clients in the biotech sector.
- Students and Educators: Utilize current market data to learn and teach valuation practices in biotechnology.
What the Template Contains
- Operating and Balance Sheet Data: Pre-filled InflaRx N.V. (IFRX) historical data and forecasts, including revenue, EBITDA, EBIT, and capital expenditures.
- WACC Calculation: A dedicated sheet for Weighted Average Cost of Capital (WACC), including parameters like Beta, risk-free rate, and share price.
- DCF Valuation (Unlevered and Levered): Editable Discounted Cash Flow models showing intrinsic value with detailed calculations.
- Financial Statements: Pre-loaded financial statements (annual and quarterly) to support analysis.
- Key Ratios: Includes profitability, leverage, and efficiency ratios for InflaRx N.V. (IFRX).
- Dashboard and Charts: Visual summary of valuation outputs and assumptions to analyze results easily.
Disclaimer
All information, articles, and product details provided on this website are for general informational and educational purposes only. We do not claim any ownership over, nor do we intend to infringe upon, any trademarks, copyrights, logos, brand names, or other intellectual property mentioned or depicted on this site. Such intellectual property remains the property of its respective owners, and any references here are made solely for identification or informational purposes, without implying any affiliation, endorsement, or partnership.
We make no representations or warranties, express or implied, regarding the accuracy, completeness, or suitability of any content or products presented. Nothing on this website should be construed as legal, tax, investment, financial, medical, or other professional advice. In addition, no part of this site—including articles or product references—constitutes a solicitation, recommendation, endorsement, advertisement, or offer to buy or sell any securities, franchises, or other financial instruments, particularly in jurisdictions where such activity would be unlawful.
All content is of a general nature and may not address the specific circumstances of any individual or entity. It is not a substitute for professional advice or services. Any actions you take based on the information provided here are strictly at your own risk. You accept full responsibility for any decisions or outcomes arising from your use of this website and agree to release us from any liability in connection with your use of, or reliance upon, the content or products found herein.