
|
IG Group Holdings Plc (IgG.L) DCF -Bewertung |
Fully Editable: Tailor To Your Needs In Excel Or Sheets
Professional Design: Trusted, Industry-Standard Templates
Investor-Approved Valuation Models
MAC/PC Compatible, Fully Unlocked
No Expertise Is Needed; Easy To Follow
IG Group Holdings plc (IGG.L) Bundle
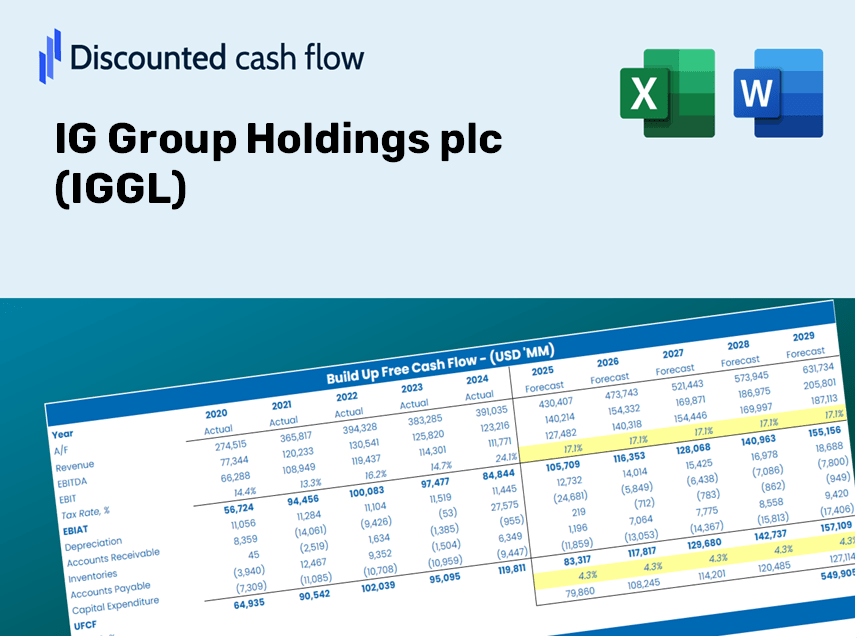
Gewinnen Sie Einblicke in Ihre IGGL -Bewertungsanalyse (IGGL) in Ihrer IG Group Holdings Plc unter Verwendung unseres ausgeklügelten DCF -Taschenrechners! Diese Excel -Vorlage wird mit realen IGGGL -Daten vorinstalliert, sodass Sie die Vorhersagen und Annahmen anpassen können, um den inneren Wert der IG -Gruppen -Holdings Plc (IGGL) genau zu bestimmen.
Discounted Cash Flow (DCF) - (USD MM)
| Year | AY1 2020 |
AY2 2021 |
AY3 2022 |
AY4 2023 |
AY5 2024 |
FY1 2025 |
FY2 2026 |
FY3 2027 |
FY4 2028 |
FY5 2029 |
|---|---|---|---|---|---|---|---|---|---|---|
| Revenue | 856.0 | 994.1 | 1,042.7 | 954.5 | 949.1 | 977.6 | 1,006.9 | 1,037.1 | 1,068.2 | 1,100.2 |
| Revenue Growth, % | 0 | 16.13 | 4.89 | -8.46 | -0.56574 | 3 | 3 | 3 | 3 | 3 |
| EBITDA | 475.9 | 544.1 | 500.1 | 443.9 | 600.9 | 524.2 | 539.9 | 556.1 | 572.8 | 590.0 |
| EBITDA, % | 55.6 | 54.73 | 47.96 | 46.51 | 63.31 | 53.62 | 53.62 | 53.62 | 53.62 | 53.62 |
| Depreciation | 25.7 | 57.5 | 61.6 | 75.8 | 65.6 | 57.8 | 59.5 | 61.3 | 63.1 | 65.0 |
| Depreciation, % | 3 | 5.78 | 5.91 | 7.94 | 6.91 | 5.91 | 5.91 | 5.91 | 5.91 | 5.91 |
| EBIT | 450.2 | 486.6 | 438.5 | 368.1 | 535.3 | 466.4 | 480.4 | 494.8 | 509.7 | 524.9 |
| EBIT, % | 52.59 | 48.95 | 42.05 | 38.56 | 56.4 | 47.71 | 47.71 | 47.71 | 47.71 | 47.71 |
| Total Cash | 808.6 | 1,482.4 | 1,025.3 | 1,092.5 | 1,071.7 | 963.5 | 992.4 | 1,022.1 | 1,052.8 | 1,084.4 |
| Total Cash, percent | .0 | .0 | .0 | .0 | .0 | .0 | .0 | .0 | .0 | .0 |
| Account Receivables | .0 | .0 | .0 | 533.9 | 404.5 | 192.7 | 198.5 | 204.4 | 210.6 | 216.9 |
| Account Receivables, % | 0 | 0 | 0 | 55.94 | 42.62 | 19.71 | 19.71 | 19.71 | 19.71 | 19.71 |
| Inventories | 30.3 | 14.2 | 15.0 | 36.6 | 51.3 | 30.6 | 31.5 | 32.5 | 33.4 | 34.4 |
| Inventories, % | 3.54 | 1.43 | 1.44 | 3.83 | 5.41 | 3.13 | 3.13 | 3.13 | 3.13 | 3.13 |
| Accounts Payable | 357.5 | 571.2 | 478.0 | 493.3 | 452.9 | 478.0 | 492.3 | 507.1 | 522.3 | 537.9 |
| Accounts Payable, % | 41.76 | 57.46 | 45.84 | 51.68 | 47.72 | 48.89 | 48.89 | 48.89 | 48.89 | 48.89 |
| Capital Expenditure | -16.0 | -17.5 | -26.2 | -15.2 | -5.8 | -16.3 | -16.8 | -17.3 | -17.8 | -18.4 |
| Capital Expenditure, % | -1.87 | -1.76 | -2.51 | -1.59 | -0.61111 | -1.67 | -1.67 | -1.67 | -1.67 | -1.67 |
| Tax Rate, % | 23.8 | 23.8 | 23.8 | 23.8 | 23.8 | 23.8 | 23.8 | 23.8 | 23.8 | 23.8 |
| EBITAT | 375.4 | 402.1 | 353.7 | 282.6 | 407.9 | 372.8 | 384.0 | 395.5 | 407.4 | 419.6 |
| Depreciation | ||||||||||
| Changes in Account Receivables | ||||||||||
| Changes in Inventories | ||||||||||
| Changes in Accounts Payable | ||||||||||
| Capital Expenditure | ||||||||||
| UFCF | 712.3 | 671.9 | 295.1 | -197.0 | 542.0 | 671.9 | 434.3 | 447.4 | 460.8 | 474.6 |
| WACC, % | 6.45 | 6.45 | 6.43 | 6.4 | 6.4 | 6.43 | 6.43 | 6.43 | 6.43 | 6.43 |
| PV UFCF | ||||||||||
| SUM PV UFCF | 2,092.6 | |||||||||
| Long Term Growth Rate, % | 2.00 | |||||||||
| Free cash flow (T + 1) | 484 | |||||||||
| Terminal Value | 10,936 | |||||||||
| Present Terminal Value | 8,009 | |||||||||
| Enterprise Value | 10,102 | |||||||||
| Net Debt | -504 | |||||||||
| Equity Value | 10,606 | |||||||||
| Diluted Shares Outstanding, MM | 362 | |||||||||
| Equity Value Per Share | 2,929.70 |
Benefits You Will Receive
- Flexible Forecast Inputs: Effortlessly modify parameters (growth %, margins, WACC) to develop various scenarios.
- Real-Time Financial Data: Pre-loaded financial information from IG Group Holdings plc (IGGL) to kickstart your analysis.
- Automatic DCF Calculations: The template computes Net Present Value (NPV) and intrinsic value automatically for your convenience.
- Customizable and Professional Design: An elegant Excel model tailored to fit your valuation requirements.
- Designed for Analysts and Investors: Perfect for evaluating projections, confirming strategies, and enhancing efficiency.
Key Features
- 🔍 Real-Life IGGL Financials: Pre-filled historical and projected data for IG Group Holdings plc (IGGL).
- ✏️ Fully Customizable Inputs: Modify all essential parameters (yellow cells) such as WACC, growth %, and tax rates.
- 📊 Professional DCF Valuation: Integrated formulas to calculate IG Group’s intrinsic value using the Discounted Cash Flow method.
- ⚡ Instant Results: Immediately visualize IG Group’s valuation after adjusting inputs.
- Scenario Analysis: Evaluate and compare results for different financial assumptions side-by-side.
How It Operates
- Download the Template: Gain immediate access to the Excel-based IG Group DCF Calculator.
- Input Your Assumptions: Modify the yellow-highlighted cells for growth rates, WACC, margins, and more.
- Instant Calculations: The model automatically recalculates the intrinsic value of IG Group Holdings plc (IGGL).
- Test Scenarios: Explore various assumptions to assess potential changes in valuation.
- Analyze and Decide: Utilize the results to inform your investment or financial decisions.
Why Opt for This Calculator?
- Designed for Experts: A sophisticated tool utilized by traders, analysts, and financial advisors.
- Accurate Data: IG Group Holdings plc’s historical and projected financials are preloaded for precision.
- Scenario Analysis: Effortlessly test various forecasts and assumptions.
- Comprehensive Outputs: Automatically computes intrinsic value, NPV, and essential metrics.
- User-Friendly: Step-by-step guidance walks you through each stage of the process.
Who Can Benefit from Using IG Group Holdings plc (IGGL)?
- Individual Traders: Enhance your trading strategies and make well-informed decisions about investing in IG Group Holdings plc (IGGL).
- Market Analysts: Improve your analysis with comprehensive data and insights tailored for IG Group Holdings plc (IGGL).
- Financial Advisors: Provide clients with expert recommendations and insights on trading IG Group Holdings plc (IGGL) effectively.
- Entrepreneurs: Gain valuable insights into the trading sector and understand how companies like IG Group Holdings plc (IGGL) operate.
- Finance Students: Explore trading dynamics and analytical methods using real-life examples from IG Group Holdings plc (IGGL).
Contents of the Template
- Pre-Filled Data: Contains IG Group's historical financial performance and projections.
- Discounted Cash Flow Model: An editable DCF valuation model featuring automatic calculations.
- Weighted Average Cost of Capital (WACC): A specific sheet designed for calculating WACC based on user-defined inputs.
- Key Financial Ratios: Assess IG Group's profitability, efficiency, and leverage metrics.
- Customizable Inputs: Effortlessly modify revenue growth, margins, and tax rates.
- Clear Dashboard: Visual summaries including charts and tables of essential valuation outcomes.
Disclaimer
All information, articles, and product details provided on this website are for general informational and educational purposes only. We do not claim any ownership over, nor do we intend to infringe upon, any trademarks, copyrights, logos, brand names, or other intellectual property mentioned or depicted on this site. Such intellectual property remains the property of its respective owners, and any references here are made solely for identification or informational purposes, without implying any affiliation, endorsement, or partnership.
We make no representations or warranties, express or implied, regarding the accuracy, completeness, or suitability of any content or products presented. Nothing on this website should be construed as legal, tax, investment, financial, medical, or other professional advice. In addition, no part of this site—including articles or product references—constitutes a solicitation, recommendation, endorsement, advertisement, or offer to buy or sell any securities, franchises, or other financial instruments, particularly in jurisdictions where such activity would be unlawful.
All content is of a general nature and may not address the specific circumstances of any individual or entity. It is not a substitute for professional advice or services. Any actions you take based on the information provided here are strictly at your own risk. You accept full responsibility for any decisions or outcomes arising from your use of this website and agree to release us from any liability in connection with your use of, or reliance upon, the content or products found herein.