
|
Internationale General Insurance Holdings Ltd. (IGIC) DCF -Bewertung |
Fully Editable: Tailor To Your Needs In Excel Or Sheets
Professional Design: Trusted, Industry-Standard Templates
Investor-Approved Valuation Models
MAC/PC Compatible, Fully Unlocked
No Expertise Is Needed; Easy To Follow
International General Insurance Holdings Ltd. (IGIC) Bundle
Gewinnen Sie einen Einblick in Ihre internationale General Insurance Holdings Ltd. (IGIC) Bewertungsanalyse unter Verwendung unseres hochmodernen DCF-Taschenrechners! Diese Excel-Vorlage mit Echtzeitdaten für (IGIC) ermöglicht es Ihnen, Prognosen und Annahmen anzupassen und eine präzise Berechnung des intrinsischen Wertes der internationalen General Insurance Holdings Ltd. (IGIC) zu ermöglichen.
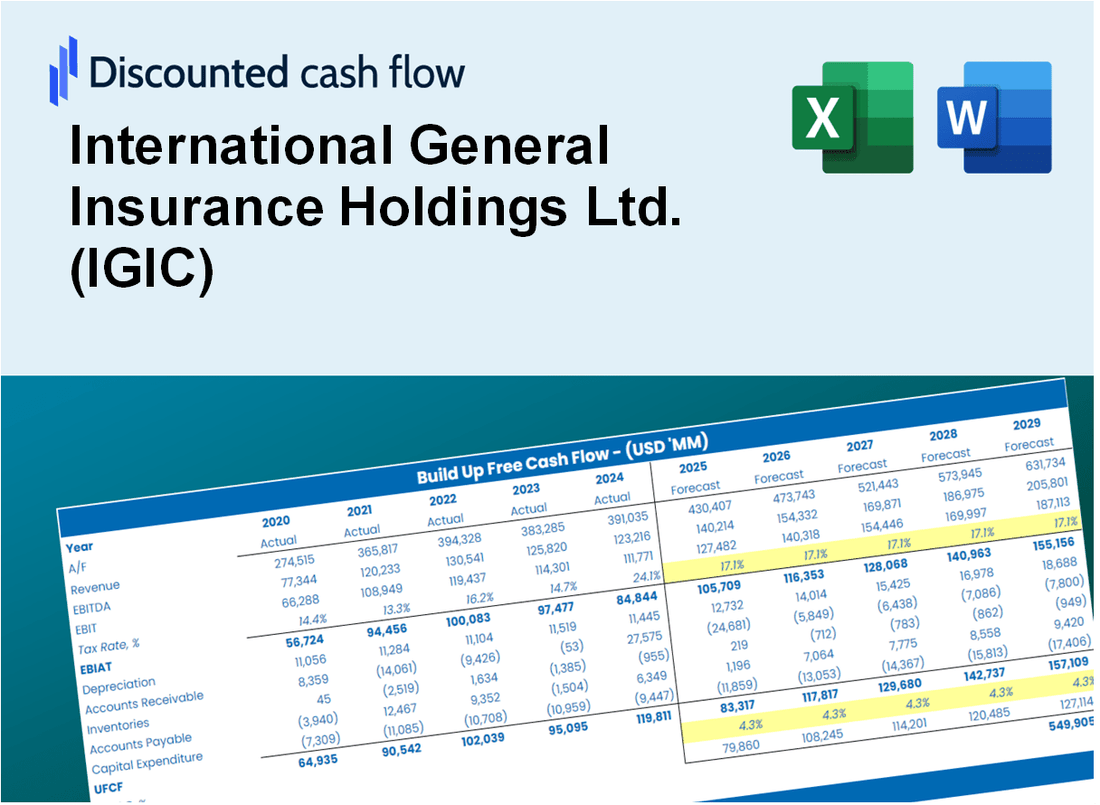
Discounted Cash Flow (DCF) - (USD MM)
| Year | AY1 2020 |
AY2 2021 |
AY3 2022 |
AY4 2023 |
AY5 2024 |
FY1 2025 |
FY2 2026 |
FY3 2027 |
FY4 2028 |
FY5 2029 |
|---|---|---|---|---|---|---|---|---|---|---|
| Revenue | 308.3 | 347.0 | 394.4 | 477.1 | 526.0 | 601.5 | 687.8 | 786.6 | 899.5 | 1,028.6 |
| Revenue Growth, % | 0 | 12.56 | 13.65 | 20.97 | 10.24 | 14.36 | 14.36 | 14.36 | 14.36 | 14.36 |
| EBITDA | 32.1 | 48.6 | 90.9 | 128.6 | 135.7 | 120.6 | 137.9 | 157.7 | 180.3 | 206.2 |
| EBITDA, % | 10.43 | 14 | 23.06 | 26.95 | 25.8 | 20.05 | 20.05 | 20.05 | 20.05 | 20.05 |
| Depreciation | 2.6 | 2.8 | 3.1 | 2.5 | 3.4 | 4.3 | 5.0 | 5.7 | 6.5 | 7.4 |
| Depreciation, % | 0.8473 | 0.79854 | 0.7815 | 0.53366 | 0.64721 | 0.72164 | 0.72164 | 0.72164 | 0.72164 | 0.72164 |
| EBIT | 29.5 | 45.8 | 87.9 | 126.0 | 132.3 | 116.2 | 132.9 | 152.0 | 173.8 | 198.8 |
| EBIT, % | 9.58 | 13.2 | 22.28 | 26.42 | 25.15 | 19.33 | 19.33 | 19.33 | 19.33 | 19.33 |
| Total Cash | 133.4 | 671.0 | 138.0 | 297.6 | 380.6 | 376.5 | 430.6 | 492.4 | 563.1 | 644.0 |
| Total Cash, percent | .0 | .0 | .0 | .0 | .0 | .0 | .0 | .0 | .0 | .0 |
| Account Receivables | 171.9 | 179.4 | 404.8 | 468.3 | 481.7 | 477.8 | 546.4 | 624.8 | 714.5 | 817.1 |
| Account Receivables, % | 55.75 | 51.69 | 102.65 | 98.16 | 91.6 | 79.44 | 79.44 | 79.44 | 79.44 | 79.44 |
| Inventories | .0 | 14.9 | .0 | -765.9 | .0 | -115.1 | -131.7 | -150.6 | -172.2 | -196.9 |
| Inventories, % | 0 | 4.29 | 0 | -160.55 | 0 | -19.14 | -19.14 | -19.14 | -19.14 | -19.14 |
| Accounts Payable | 88.5 | 100.8 | 90.4 | 89.7 | 90.0 | 140.2 | 160.4 | 183.4 | 209.7 | 239.8 |
| Accounts Payable, % | 28.7 | 29.04 | 22.91 | 18.8 | 17.12 | 23.32 | 23.32 | 23.32 | 23.32 | 23.32 |
| Capital Expenditure | -1.9 | -2.3 | -1.3 | -3.2 | -6.6 | -4.3 | -4.9 | -5.6 | -6.4 | -7.3 |
| Capital Expenditure, % | -0.61795 | -0.67577 | -0.32102 | -0.6808 | -1.26 | -0.71115 | -0.71115 | -0.71115 | -0.71115 | -0.71115 |
| Tax Rate, % | -2.16 | -2.16 | -2.16 | -2.16 | -2.16 | -2.16 | -2.16 | -2.16 | -2.16 | -2.16 |
| EBITAT | 27.4 | 44.1 | 85.1 | 118.2 | 135.2 | 111.5 | 127.6 | 145.9 | 166.8 | 190.8 |
| Depreciation | ||||||||||
| Changes in Account Receivables | ||||||||||
| Changes in Inventories | ||||||||||
| Changes in Accounts Payable | ||||||||||
| Capital Expenditure | ||||||||||
| UFCF | -55.2 | 34.4 | -134.1 | 819.3 | -647.1 | 280.9 | 95.7 | 109.4 | 125.1 | 143.1 |
| WACC, % | 4.68 | 4.68 | 4.68 | 4.68 | 4.68 | 4.68 | 4.68 | 4.68 | 4.68 | 4.68 |
| PV UFCF | ||||||||||
| SUM PV UFCF | 669.1 | |||||||||
| Long Term Growth Rate, % | 2.00 | |||||||||
| Free cash flow (T + 1) | 146 | |||||||||
| Terminal Value | 5,447 | |||||||||
| Present Terminal Value | 4,334 | |||||||||
| Enterprise Value | 5,003 | |||||||||
| Net Debt | -155 | |||||||||
| Equity Value | 5,158 | |||||||||
| Diluted Shares Outstanding, MM | 45 | |||||||||
| Equity Value Per Share | 115.30 |
What You Will Get
- Real IGIC Data: Preloaded financials – from revenue to EBIT – based on actual and projected figures for International General Insurance Holdings Ltd. (IGIC).
- Full Customization: Adjust all critical parameters (yellow cells) like WACC, growth %, and tax rates to fit your analysis.
- Instant Valuation Updates: Automatic recalculations to assess the impact of changes on IGIC’s fair value.
- Versatile Excel Template: Designed for quick edits, scenario testing, and detailed projections specifically for IGIC.
- Time-Saving and Accurate: Avoid the hassle of building models from scratch while ensuring precision and flexibility.
Key Features
- Comprehensive Historical Data: Access IGIC’s (IGIC) past financial statements and pre-filled projections.
- Customizable Parameters: Modify WACC, tax rates, revenue growth, and EBITDA margins to fit your analysis.
- Real-Time Valuation: Instantly view the recalculated intrinsic value of IGIC (IGIC) as you adjust inputs.
- Insightful Visualizations: Interactive dashboard charts present valuation outcomes and essential metrics.
- Designed for Precision: A robust tool tailored for analysts, investors, and finance professionals.
How It Works
- Step 1: Download the Excel file.
- Step 2: Review pre-entered International General Insurance Holdings Ltd. (IGIC) data (historical and projected).
- Step 3: Adjust key assumptions (yellow cells) based on your analysis.
- Step 4: View automatic recalculations for International General Insurance Holdings Ltd.'s (IGIC) intrinsic value.
- Step 5: Use the outputs for investment decisions or reporting.
Why Choose International General Insurance Holdings Ltd. (IGIC)?
- Comprehensive Coverage: Our policies are designed to meet a wide range of insurance needs.
- Expertise You Can Trust: Backed by a team of industry professionals with extensive experience.
- Customer-Centric Approach: We prioritize our clients' needs and provide personalized service.
- Innovative Solutions: We leverage the latest technology to enhance your insurance experience.
- Strong Financial Stability: IGIC is committed to maintaining a robust financial foundation for our clients’ peace of mind.
Who Should Use This Product?
- Professional Investors: Develop comprehensive and accurate valuation models for assessing IGIC's market performance.
- Corporate Finance Teams: Evaluate valuation scenarios to inform strategic decisions within the organization.
- Consultants and Advisors: Deliver precise valuation insights to clients regarding International General Insurance Holdings Ltd. (IGIC).
- Students and Educators: Utilize real-world data to enhance learning and practice in financial modeling.
- Insurance Industry Analysts: Gain a deeper understanding of how companies like IGIC are valued in the insurance market.
What the Template Contains
- Pre-Filled DCF Model: International General Insurance Holdings Ltd. (IGIC)’s financial data preloaded for immediate use.
- WACC Calculator: Detailed calculations for Weighted Average Cost of Capital.
- Financial Ratios: Evaluate IGIC’s profitability, leverage, and efficiency.
- Editable Inputs: Change assumptions such as growth, margins, and CAPEX to fit your scenarios.
- Financial Statements: Annual and quarterly reports to support detailed analysis.
- Interactive Dashboard: Easily visualize key valuation metrics and results.
Disclaimer
All information, articles, and product details provided on this website are for general informational and educational purposes only. We do not claim any ownership over, nor do we intend to infringe upon, any trademarks, copyrights, logos, brand names, or other intellectual property mentioned or depicted on this site. Such intellectual property remains the property of its respective owners, and any references here are made solely for identification or informational purposes, without implying any affiliation, endorsement, or partnership.
We make no representations or warranties, express or implied, regarding the accuracy, completeness, or suitability of any content or products presented. Nothing on this website should be construed as legal, tax, investment, financial, medical, or other professional advice. In addition, no part of this site—including articles or product references—constitutes a solicitation, recommendation, endorsement, advertisement, or offer to buy or sell any securities, franchises, or other financial instruments, particularly in jurisdictions where such activity would be unlawful.
All content is of a general nature and may not address the specific circumstances of any individual or entity. It is not a substitute for professional advice or services. Any actions you take based on the information provided here are strictly at your own risk. You accept full responsibility for any decisions or outcomes arising from your use of this website and agree to release us from any liability in connection with your use of, or reliance upon, the content or products found herein.