
|
Indraprastha Gas Limited (IGL.NS) DCF -Bewertung |
Fully Editable: Tailor To Your Needs In Excel Or Sheets
Professional Design: Trusted, Industry-Standard Templates
Investor-Approved Valuation Models
MAC/PC Compatible, Fully Unlocked
No Expertise Is Needed; Easy To Follow
Indraprastha Gas Limited (IGL.NS) Bundle
Unser (IGLNS) DCF-Taschenrechner (IGLNS) ermöglicht es Ihnen, die Bewertung von Indraprastha Gas Limited mithilfe realer Finanzdaten zu bewerten und vollständige Flexibilität zu bieten, um alle wesentlichen Parameter für verbesserte Projektionen zu ändern.
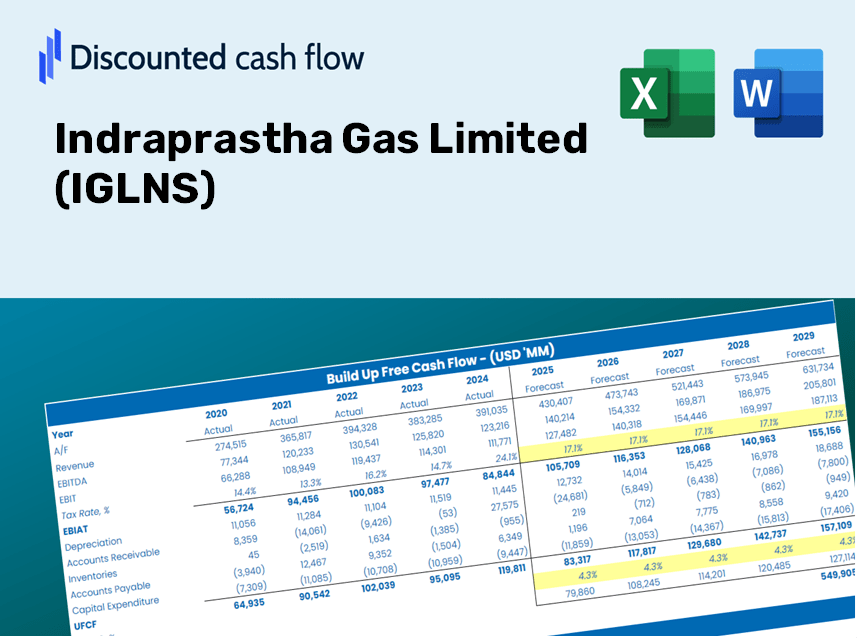
Discounted Cash Flow (DCF) - (USD MM)
| Year | AY1 2021 |
AY2 2022 |
AY3 2023 |
AY4 2024 |
AY5 2025 |
FY1 2026 |
FY2 2027 |
FY3 2028 |
FY4 2029 |
FY5 2030 |
|---|---|---|---|---|---|---|---|---|---|---|
| Revenue | 49,408.0 | 77,099.6 | 141,458.5 | 140,000.2 | 149,278.0 | 145,671.8 | 142,152.6 | 138,718.5 | 135,367.4 | 132,097.2 |
| Revenue Growth, % | 0 | 56.05 | 83.48 | -1.03 | 6.63 | -2.42 | -2.42 | -2.42 | -2.42 | -2.42 |
| EBITDA | 16,060.6 | 20,650.4 | 22,589.4 | 29,632.7 | 19,732.8 | 31,944.1 | 31,172.4 | 30,419.3 | 29,684.5 | 28,967.3 |
| EBITDA, % | 32.51 | 26.78 | 15.97 | 21.17 | 13.22 | 21.93 | 21.93 | 21.93 | 21.93 | 21.93 |
| Depreciation | 2,903.9 | 3,170.6 | 3,633.6 | 4,139.6 | 4,758.6 | 5,449.0 | 5,317.4 | 5,188.9 | 5,063.6 | 4,941.2 |
| Depreciation, % | 5.88 | 4.11 | 2.57 | 2.96 | 3.19 | 3.74 | 3.74 | 3.74 | 3.74 | 3.74 |
| EBIT | 13,156.7 | 17,479.8 | 18,955.8 | 25,493.1 | 14,974.2 | 26,495.1 | 25,855.0 | 25,230.4 | 24,620.9 | 24,026.1 |
| EBIT, % | 26.63 | 22.67 | 13.4 | 18.21 | 10.03 | 18.19 | 18.19 | 18.19 | 18.19 | 18.19 |
| Total Cash | 26,891.0 | 30,607.2 | 18,297.4 | 30,096.6 | 35,944.3 | 44,469.5 | 43,395.2 | 42,346.8 | 41,323.8 | 40,325.5 |
| Total Cash, percent | .0 | .0 | .0 | .0 | .0 | .0 | .0 | .0 | .0 | .0 |
| Account Receivables | 3,298.3 | 6,116.7 | 10,481.3 | 11,308.4 | 7,067.0 | 10,147.5 | 9,902.4 | 9,663.2 | 9,429.7 | 9,201.9 |
| Account Receivables, % | 6.68 | 7.93 | 7.41 | 8.08 | 4.73 | 6.97 | 6.97 | 6.97 | 6.97 | 6.97 |
| Inventories | 455.5 | 455.2 | 491.7 | 557.2 | 487.6 | 753.0 | 734.8 | 717.1 | 699.7 | 682.8 |
| Inventories, % | 0.92192 | 0.59041 | 0.34759 | 0.398 | 0.32664 | 0.51691 | 0.51691 | 0.51691 | 0.51691 | 0.51691 |
| Accounts Payable | 4,186.0 | 7,861.1 | 9,013.3 | 9,843.1 | 9,345.7 | 11,167.6 | 10,897.8 | 10,634.6 | 10,377.6 | 10,126.9 |
| Accounts Payable, % | 8.47 | 10.2 | 6.37 | 7.03 | 6.26 | 7.67 | 7.67 | 7.67 | 7.67 | 7.67 |
| Capital Expenditure | -8,829.2 | -13,369.5 | -11,220.5 | -12,290.5 | -11,642.2 | -17,399.2 | -16,978.8 | -16,568.7 | -16,168.4 | -15,777.8 |
| Capital Expenditure, % | -17.87 | -17.34 | -7.93 | -8.78 | -7.8 | -11.94 | -11.94 | -11.94 | -11.94 | -11.94 |
| Tax Rate, % | 21.3 | 21.3 | 21.3 | 21.3 | 21.3 | 21.3 | 21.3 | 21.3 | 21.3 | 21.3 |
| EBITAT | 10,849.5 | 13,444.3 | 14,644.4 | 19,903.9 | 11,785.4 | 20,847.0 | 20,343.4 | 19,851.9 | 19,372.4 | 18,904.4 |
| Depreciation | ||||||||||
| Changes in Account Receivables | ||||||||||
| Changes in Inventories | ||||||||||
| Changes in Accounts Payable | ||||||||||
| Capital Expenditure | ||||||||||
| UFCF | 5,356.4 | 4,102.4 | 3,808.6 | 11,690.2 | 8,715.4 | 7,372.8 | 8,675.5 | 8,465.9 | 8,261.4 | 8,061.8 |
| WACC, % | 6.59 | 6.59 | 6.59 | 6.59 | 6.59 | 6.59 | 6.59 | 6.59 | 6.59 | 6.59 |
| PV UFCF | ||||||||||
| SUM PV UFCF | 33,801.5 | |||||||||
| Long Term Growth Rate, % | 3.00 | |||||||||
| Free cash flow (T + 1) | 8,304 | |||||||||
| Terminal Value | 231,189 | |||||||||
| Present Terminal Value | 168,016 | |||||||||
| Enterprise Value | 201,817 | |||||||||
| Net Debt | -21,719 | |||||||||
| Equity Value | 223,536 | |||||||||
| Diluted Shares Outstanding, MM | 1,400 | |||||||||
| Equity Value Per Share | 159.67 |
What You Will Receive
- Authentic IGLNS Financial Data: Access to historical and projected figures for precise valuation.
- Customizable Parameters: Adjust WACC, tax rates, revenue growth, and capital expenditures to fit your analysis.
- Dynamic Calculations: Intrinsic value and NPV are computed automatically.
- Scenario Testing: Assess various scenarios to forecast Indraprastha Gas Limited's future performance.
- User-Friendly Interface: Designed for professionals, yet easy for newcomers to navigate.
Key Features
- 🔍 Real-Life IGLNS Financials: Pre-filled historical and projected data for Indraprastha Gas Limited.
- ✏️ Fully Customizable Inputs: Modify all essential parameters (yellow cells) such as WACC, growth %, and tax rates.
- 📊 Professional DCF Valuation: Utilizes built-in formulas to determine Indraprastha Gas’s intrinsic value via the Discounted Cash Flow method.
- ⚡ Instant Results: View Indraprastha Gas’s valuation immediately after adjustments.
- Scenario Analysis: Evaluate and contrast outcomes for different financial assumptions side-by-side.
How It Works
- Download: Get the pre-configured Excel file featuring Indraprastha Gas Limited's (IGLNS) financial data.
- Customize: Modify projections such as revenue growth, EBITDA %, and WACC to suit your analysis.
- Update Automatically: Enjoy real-time updates on intrinsic value and NPV calculations as you make changes.
- Test Scenarios: Generate various forecasts and immediately compare the results side by side.
- Make Decisions: Leverage the valuation insights to inform your investment choices.
Why Opt for IGLNS Calculator?
- Precision: Utilizes authentic Indraprastha Gas Limited financials for reliable data.
- Adaptability: Built to allow users to experiment and alter inputs as needed.
- Efficiency: Avoid the complexities of creating a DCF model from the ground up.
- Corporate-Standard: Crafted with the accuracy and functionality expected at the CFO level.
- Intuitive: Simple to navigate, making it accessible for users without advanced financial expertise.
Who Should Use This Product?
- Individual Investors: Make informed choices about trading Indraprastha Gas Limited (IGLNS) shares.
- Financial Analysts: Enhance valuation procedures with comprehensive financial models tailored for IGLNS.
- Consultants: Provide clients with accurate and prompt valuation insights for Indraprastha Gas Limited (IGLNS).
- Business Owners: Gain insights into how large firms like Indraprastha Gas Limited (IGLNS) are valued to inform your own business strategies.
- Finance Students: Acquire valuation skills using real-world data and case studies related to Indraprastha Gas Limited (IGLNS).
Contents of the Template
- Historical Data: Encompasses IGLNS's previous financial performance and initial forecasts.
- DCF and Levered DCF Models: Comprehensive templates designed to determine IGLNS's intrinsic value.
- WACC Sheet: Ready-to-use calculations for the Weighted Average Cost of Capital.
- Editable Inputs: Adjust essential parameters such as growth rates, EBITDA percentages, and CAPEX estimates.
- Quarterly and Annual Statements: An in-depth overview of IGLNS's financial statements.
- Interactive Dashboard: Dynamically visualize valuation outcomes and forecasts.
Disclaimer
All information, articles, and product details provided on this website are for general informational and educational purposes only. We do not claim any ownership over, nor do we intend to infringe upon, any trademarks, copyrights, logos, brand names, or other intellectual property mentioned or depicted on this site. Such intellectual property remains the property of its respective owners, and any references here are made solely for identification or informational purposes, without implying any affiliation, endorsement, or partnership.
We make no representations or warranties, express or implied, regarding the accuracy, completeness, or suitability of any content or products presented. Nothing on this website should be construed as legal, tax, investment, financial, medical, or other professional advice. In addition, no part of this site—including articles or product references—constitutes a solicitation, recommendation, endorsement, advertisement, or offer to buy or sell any securities, franchises, or other financial instruments, particularly in jurisdictions where such activity would be unlawful.
All content is of a general nature and may not address the specific circumstances of any individual or entity. It is not a substitute for professional advice or services. Any actions you take based on the information provided here are strictly at your own risk. You accept full responsibility for any decisions or outcomes arising from your use of this website and agree to release us from any liability in connection with your use of, or reliance upon, the content or products found herein.