
|
IGM Biosciences, Inc. (IGMS) DCF -Bewertung |
Fully Editable: Tailor To Your Needs In Excel Or Sheets
Professional Design: Trusted, Industry-Standard Templates
Investor-Approved Valuation Models
MAC/PC Compatible, Fully Unlocked
No Expertise Is Needed; Easy To Follow
IGM Biosciences, Inc. (IGMS) Bundle
Bewerten Sie die finanzielle Aussichten von IgM Biosciences, Inc. wie ein Experte! Dieser (IGMS) DCF-Taschenrechner bietet vorgefüllte Finanzdaten sowie die vollständige Flexibilität, um das Umsatzwachstum, WACC, Margen und andere wesentliche Annahmen zu ändern, um sich mit Ihren Vorhersagen auszurichten.
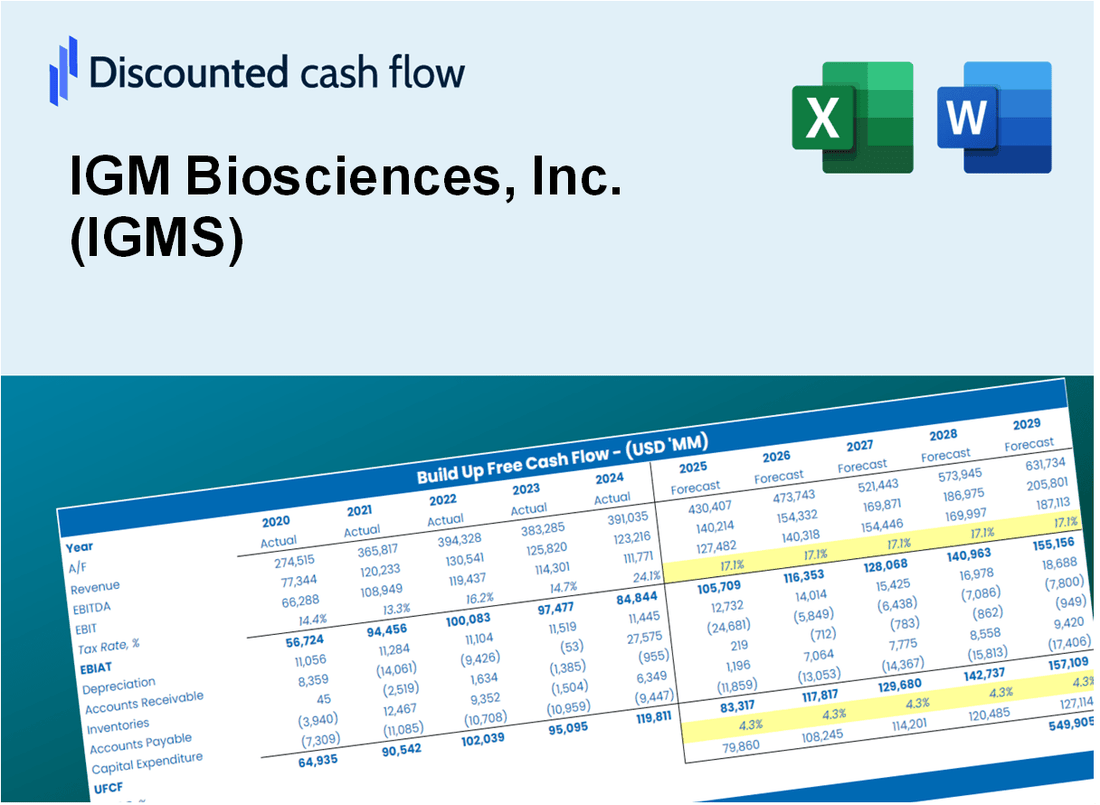
Discounted Cash Flow (DCF) - (USD MM)
| Year | AY1 2020 |
AY2 2021 |
AY3 2022 |
AY4 2023 |
AY5 2024 |
FY1 2025 |
FY2 2026 |
FY3 2027 |
FY4 2028 |
FY5 2029 |
|---|---|---|---|---|---|---|---|---|---|---|
| Revenue | .0 | .0 | 1.1 | 2.1 | 2.7 | 3.5 | 4.6 | 6.1 | 8.0 | 10.4 |
| Revenue Growth, % | 0 | 0 | 0 | 99.25 | 25.77 | 31.26 | 31.26 | 31.26 | 31.26 | 31.26 |
| EBITDA | -77.8 | -157.4 | -221.9 | -255.2 | -199.5 | -.7 | -.9 | -1.2 | -1.6 | -2.1 |
| EBITDA, % | 100 | 100 | -20755.94 | -11980.47 | -7445.61 | -20 | -20 | -20 | -20 | -20 |
| Depreciation | 3.6 | 7.7 | 10.6 | 8.3 | 9.1 | 3.5 | 4.6 | 6.1 | 8.0 | 10.4 |
| Depreciation, % | 100 | 100 | 991.77 | 388.59 | 340.13 | 100 | 100 | 100 | 100 | 100 |
| EBIT | -81.4 | -165.2 | -232.5 | -263.5 | -208.6 | -.7 | -.9 | -1.2 | -1.6 | -2.1 |
| EBIT, % | 100 | 100 | -21747.71 | -12369.06 | -7785.74 | -20 | -20 | -20 | -20 | -20 |
| Total Cash | 366.3 | 229.5 | 427.2 | 337.7 | 183.8 | 3.5 | 4.6 | 6.1 | 8.0 | 10.4 |
| Total Cash, percent | .0 | .0 | .0 | .0 | .0 | .0 | .0 | .0 | .0 | .0 |
| Account Receivables | .0 | .0 | .0 | .0 | .8 | 1.6 | 2.1 | 2.8 | 3.7 | 4.8 |
| Account Receivables, % | 100 | 100 | 0 | 0 | 29.86 | 45.97 | 45.97 | 45.97 | 45.97 | 45.97 |
| Inventories | .0 | .0 | .0 | .0 | .0 | 1.4 | 1.8 | 2.4 | 3.2 | 4.2 |
| Inventories, % | 100 | 100 | 0 | 0 | 0 | 40 | 40 | 40 | 40 | 40 |
| Accounts Payable | 7.9 | 5.6 | 2.5 | 1.3 | 1.0 | 2.8 | 3.7 | 4.8 | 6.3 | 8.3 |
| Accounts Payable, % | 100 | 100 | 234.99 | 62.25 | 36.69 | 79.79 | 79.79 | 79.79 | 79.79 | 79.79 |
| Capital Expenditure | -17.5 | -13.2 | -10.2 | -12.4 | -5.9 | -2.1 | -2.8 | -3.6 | -4.8 | -6.3 |
| Capital Expenditure, % | 100 | 100 | -954.72 | -581.27 | -218.44 | -60 | -60 | -60 | -60 | -60 |
| Tax Rate, % | 0 | 0 | 0 | 0 | 0 | 0 | 0 | 0 | 0 | 0 |
| EBITAT | -80.3 | -160.7 | -225.3 | -264.2 | -208.6 | -.7 | -.9 | -1.2 | -1.6 | -2.1 |
| Depreciation | ||||||||||
| Changes in Account Receivables | ||||||||||
| Changes in Inventories | ||||||||||
| Changes in Accounts Payable | ||||||||||
| Capital Expenditure | ||||||||||
| UFCF | -86.3 | -168.5 | -228.0 | -269.5 | -206.5 | .3 | .9 | 1.1 | 1.5 | 2.0 |
| WACC, % | 5.51 | 5.48 | 5.48 | 5.52 | 5.52 | 5.5 | 5.5 | 5.5 | 5.5 | 5.5 |
| PV UFCF | ||||||||||
| SUM PV UFCF | 4.8 | |||||||||
| Long Term Growth Rate, % | 2.00 | |||||||||
| Free cash flow (T + 1) | 2 | |||||||||
| Terminal Value | 57 | |||||||||
| Present Terminal Value | 44 | |||||||||
| Enterprise Value | 48 | |||||||||
| Net Debt | 19 | |||||||||
| Equity Value | 30 | |||||||||
| Diluted Shares Outstanding, MM | 61 | |||||||||
| Equity Value Per Share | 0.49 |
What You Will Get
- Editable Excel Template: A fully customizable Excel-based DCF Calculator featuring pre-filled real IGMS financials.
- Real-World Data: Historical data and forward-looking estimates (as indicated in the yellow cells).
- Forecast Flexibility: Modify forecast assumptions such as revenue growth, EBITDA %, and WACC.
- Automatic Calculations: Instantly observe the effect of your inputs on IGM Biosciences’ valuation.
- Professional Tool: Designed for investors, CFOs, consultants, and financial analysts.
- User-Friendly Design: Organized for clarity and ease of use, complete with step-by-step instructions.
Key Features
- Comprehensive Data: IGM Biosciences’ historical financial statements and pre-filled projections.
- Customizable Inputs: Adjust WACC, tax rates, revenue growth, and EBITDA margins to suit your analysis.
- Real-Time Insights: Monitor IGM Biosciences’ intrinsic value recalculating instantly.
- Interactive Visuals: Dashboard graphs showcase valuation outcomes and essential metrics.
- Designed for Precision: A professional-grade tool for analysts, investors, and finance professionals.
How It Works
- Download the Template: Gain immediate access to the Excel-based IGM Biosciences (IGMS) DCF Calculator.
- Input Your Assumptions: Modify the yellow-highlighted cells for growth rates, WACC, margins, and other key variables.
- Instant Calculations: The model automatically computes the intrinsic value of IGM Biosciences.
- Test Scenarios: Experiment with various assumptions to assess potential changes in valuation.
- Analyze and Decide: Leverage the results to inform your investment or financial evaluation.
Why Choose This Calculator for IGM Biosciences, Inc. (IGMS)?
- User-Friendly Interface: Perfect for both newcomers and seasoned professionals.
- Customizable Parameters: Adjust inputs easily to suit your financial analysis.
- Real-Time Insights: Watch IGM Biosciences’ valuation update instantly as you change inputs.
- Pre-Loaded Data: Comes with IGM Biosciences’ actual financial metrics for immediate evaluation.
- Relied Upon by Experts: A go-to tool for investors and analysts making strategic choices.
Who Should Use This Product?
- Investors: Accurately assess IGM Biosciences, Inc.'s (IGMS) fair value prior to making investment choices.
- CFOs: Utilize a professional-grade DCF model for comprehensive financial reporting and analysis.
- Consultants: Efficiently customize the template for client valuation reports.
- Entrepreneurs: Acquire insights into the financial modeling practices of top biotech firms.
- Educators: Employ it as a teaching resource to illustrate valuation techniques.
What the Template Contains
- Comprehensive DCF Model: Editable template featuring detailed valuation calculations tailored for IGM Biosciences, Inc. (IGMS).
- Real-World Data: IGM Biosciences' historical and projected financials preloaded for in-depth analysis.
- Customizable Parameters: Modify WACC, growth rates, and tax assumptions to explore various scenarios.
- Financial Statements: Complete annual and quarterly breakdowns to gain deeper insights into financial performance.
- Key Ratios: Integrated analysis for profitability, efficiency, and leverage specific to IGM Biosciences, Inc. (IGMS).
- Dashboard with Visual Outputs: Visual representations including charts and tables for clear, actionable results.
Disclaimer
All information, articles, and product details provided on this website are for general informational and educational purposes only. We do not claim any ownership over, nor do we intend to infringe upon, any trademarks, copyrights, logos, brand names, or other intellectual property mentioned or depicted on this site. Such intellectual property remains the property of its respective owners, and any references here are made solely for identification or informational purposes, without implying any affiliation, endorsement, or partnership.
We make no representations or warranties, express or implied, regarding the accuracy, completeness, or suitability of any content or products presented. Nothing on this website should be construed as legal, tax, investment, financial, medical, or other professional advice. In addition, no part of this site—including articles or product references—constitutes a solicitation, recommendation, endorsement, advertisement, or offer to buy or sell any securities, franchises, or other financial instruments, particularly in jurisdictions where such activity would be unlawful.
All content is of a general nature and may not address the specific circumstances of any individual or entity. It is not a substitute for professional advice or services. Any actions you take based on the information provided here are strictly at your own risk. You accept full responsibility for any decisions or outcomes arising from your use of this website and agree to release us from any liability in connection with your use of, or reliance upon, the content or products found herein.