
|
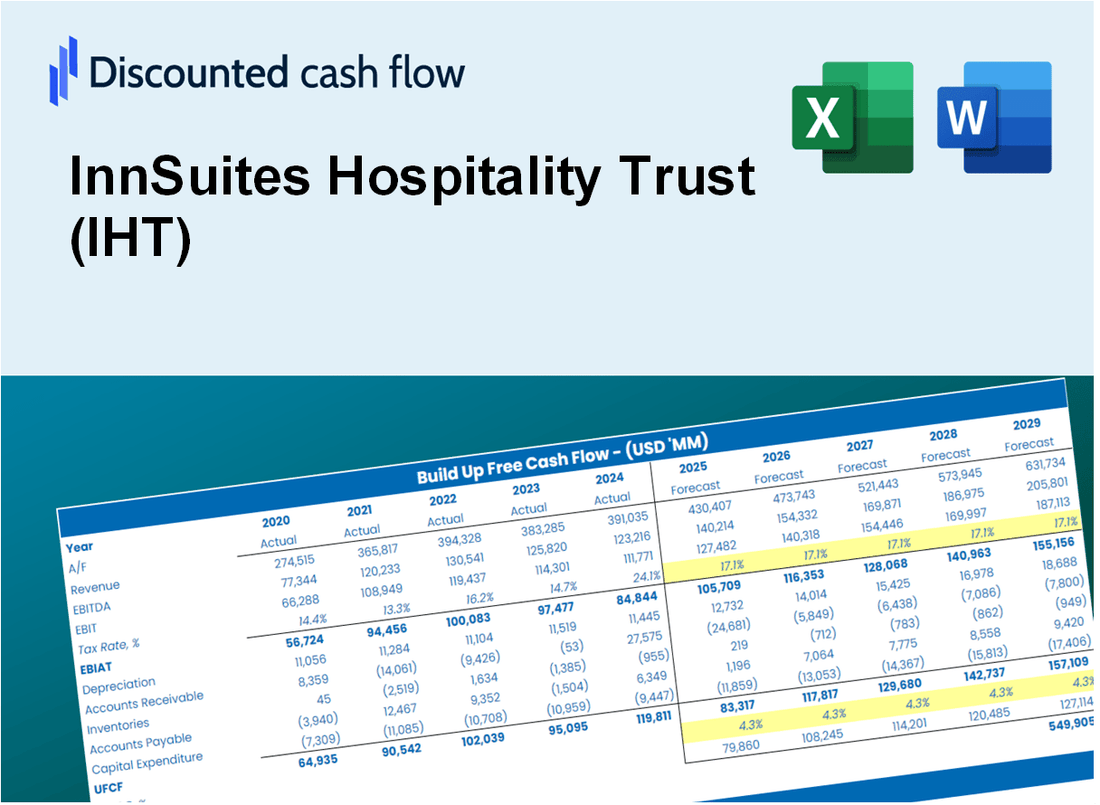
Innsuites Hospitality Trust (IHT) DCF -Bewertung |
Fully Editable: Tailor To Your Needs In Excel Or Sheets
Professional Design: Trusted, Industry-Standard Templates
Investor-Approved Valuation Models
MAC/PC Compatible, Fully Unlocked
No Expertise Is Needed; Easy To Follow
InnSuites Hospitality Trust (IHT) Bundle
Entdecken Sie den wahren Wert des Innsuites Hospitality Trust (IHT) mit unserem fortschrittlichen DCF -Taschenrechner! Passen Sie die wichtigsten Annahmen an, erkunden Sie verschiedene Szenarien und untersuchen, wie sich Änderungen auf die Bewertung des Innsuites Hospitality Trust (IHT) auswirken-alles innerhalb einer benutzerfreundlichen Excel-Vorlage.
What You Will Get
- Real IHT Financials: Access to historical and projected data for precise valuation.
- Customizable Inputs: Adjust WACC, tax rates, revenue growth, and capital expenditures.
- Dynamic Calculations: Intrinsic value and NPV are computed in real-time.
- Scenario Analysis: Explore various scenarios to assess InnSuites' future performance.
- User-Friendly Design: Designed for professionals while remaining approachable for newcomers.
Key Features
- Customizable Financial Inputs: Adjust essential variables such as occupancy rates, average daily rates, and operating expenses.
- Instant Valuation Calculations: Automatically computes intrinsic value, cash flow projections, and other financial metrics.
- High-Precision Estimates: Leverages InnSuites Hospitality Trust's (IHT) actual performance data for accurate valuation results.
- Effortless Scenario Testing: Easily evaluate various market conditions and their impacts on financial outcomes.
- Efficiency Booster: Streamline your analysis process without the need for intricate financial models.
How It Works
- Step 1: Download the Excel file.
- Step 2: Review pre-entered InnSuites Hospitality Trust (IHT) data (historical and projected).
- Step 3: Adjust key assumptions (yellow cells) based on your analysis.
- Step 4: View automatic recalculations for InnSuites Hospitality Trust’s intrinsic value.
- Step 5: Use the outputs for investment decisions or reporting.
Why Choose This Calculator for InnSuites Hospitality Trust (IHT)?
- Accuracy: Utilizes real InnSuites financial data to ensure precise calculations.
- Flexibility: Allows users to easily test and adjust inputs as needed.
- Time-Saving: Avoid the complexities of constructing a DCF model from the ground up.
- Professional-Grade: Crafted with the expertise and usability expected by CFOs.
- User-Friendly: Intuitive design makes it accessible for users without extensive financial modeling skills.
Who Should Use This Product?
- Hospitality Students: Explore real estate valuation techniques and apply them to the hospitality sector.
- Researchers: Utilize professional financial models in your studies or academic papers.
- Investors: Evaluate your investment strategies and analyze valuation scenarios for InnSuites Hospitality Trust (IHT).
- Financial Analysts: Enhance your analytical process with a customizable DCF model tailored for hospitality investments.
- Entrepreneurs: Understand the valuation methods used for publicly traded hospitality companies like InnSuites.
What the Template Contains
- Pre-Filled Data: Contains InnSuites Hospitality Trust’s (IHT) historical financial performance and projections.
- Discounted Cash Flow Model: An editable DCF valuation model featuring automatic calculations.
- Weighted Average Cost of Capital (WACC): A specific sheet for computing WACC based on user-defined inputs.
- Key Financial Ratios: Evaluate InnSuites Hospitality Trust’s (IHT) profitability, efficiency, and capital structure.
- Customizable Inputs: Easily modify revenue growth, profit margins, and tax rates.
- Clear Dashboard: Visual representations and tables summarizing essential valuation outcomes.
Disclaimer
All information, articles, and product details provided on this website are for general informational and educational purposes only. We do not claim any ownership over, nor do we intend to infringe upon, any trademarks, copyrights, logos, brand names, or other intellectual property mentioned or depicted on this site. Such intellectual property remains the property of its respective owners, and any references here are made solely for identification or informational purposes, without implying any affiliation, endorsement, or partnership.
We make no representations or warranties, express or implied, regarding the accuracy, completeness, or suitability of any content or products presented. Nothing on this website should be construed as legal, tax, investment, financial, medical, or other professional advice. In addition, no part of this site—including articles or product references—constitutes a solicitation, recommendation, endorsement, advertisement, or offer to buy or sell any securities, franchises, or other financial instruments, particularly in jurisdictions where such activity would be unlawful.
All content is of a general nature and may not address the specific circumstances of any individual or entity. It is not a substitute for professional advice or services. Any actions you take based on the information provided here are strictly at your own risk. You accept full responsibility for any decisions or outcomes arising from your use of this website and agree to release us from any liability in connection with your use of, or reliance upon, the content or products found herein.