
|
Immunocore Holdings plc (IMCR) DCF -Bewertung |
Fully Editable: Tailor To Your Needs In Excel Or Sheets
Professional Design: Trusted, Industry-Standard Templates
Investor-Approved Valuation Models
MAC/PC Compatible, Fully Unlocked
No Expertise Is Needed; Easy To Follow
Immunocore Holdings plc (IMCR) Bundle
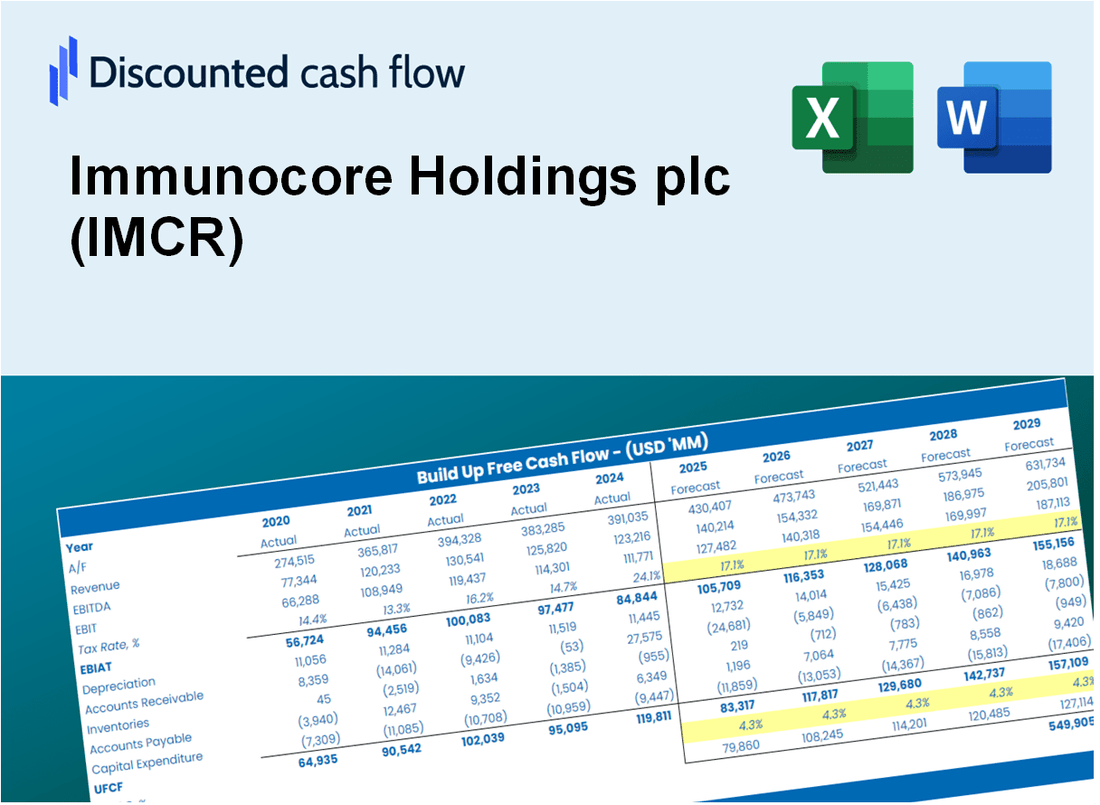
Gewinnen Sie einen Einblick in Ihre Bewertungsanalyse für Immunocore Holdings Plc (IMCR) unter Verwendung unseres ausgeklügelten DCF -Taschenrechners! Diese Excel -Vorlage wird mit realen IMCR -Daten vorinstalliert, sodass Sie Prognosen und Annahmen anpassen können, um den inneren Wert von Immunocore Holdings Plc genau zu bestimmen.
What You Will Get
- Editable Forecast Inputs: Easily modify assumptions (growth %, margins, WACC) to explore various scenarios.
- Real-World Data: Immunocore Holdings plc’s (IMCR) financial data pre-loaded to enhance your analysis.
- Automatic DCF Outputs: The template computes Net Present Value (NPV) and intrinsic value automatically.
- Customizable and Professional: A refined Excel model tailored to meet your valuation requirements.
- Built for Analysts and Investors: Perfect for testing forecasts, verifying strategies, and increasing efficiency.
Key Features
- 🔍 Real-Life IMCR Financials: Pre-filled historical and projected data for Immunocore Holdings plc.
- ✏️ Fully Customizable Inputs: Adjust all critical parameters (yellow cells) like WACC, growth %, and tax rates.
- 📊 Professional DCF Valuation: Built-in formulas calculate Immunocore’s intrinsic value using the Discounted Cash Flow method.
- ⚡ Instant Results: Visualize Immunocore’s valuation instantly after making changes.
- Scenario Analysis: Test and compare outcomes for various financial assumptions side-by-side.
How It Works
- Step 1: Download the Excel file.
- Step 2: Review Immunocore Holdings plc's (IMCR) pre-filled financial data and forecasts.
- Step 3: Modify critical inputs such as revenue growth, WACC, and tax rates (highlighted cells).
- Step 4: Watch the DCF model update instantly as you adjust your assumptions.
- Step 5: Analyze the outputs and utilize the results for your investment decisions.
Why Choose the Immunocore Holdings plc (IMCR) Calculator?
- Accuracy: Utilizes real Immunocore financial data for precise calculations.
- Flexibility: Allows users to easily experiment with and adjust inputs.
- Time-Saving: Eliminate the need to create a financial model from the ground up.
- Professional-Grade: Crafted with the expertise and precision expected at the CFO level.
- User-Friendly: Intuitive interface designed for users of all financial backgrounds.
Who Should Use This Product?
- Investors: Accurately assess Immunocore Holdings plc’s (IMCR) fair value prior to making investment choices.
- CFOs: Utilize a professional-grade DCF model for comprehensive financial reporting and analysis.
- Consultants: Efficiently customize the template for client valuation reports.
- Entrepreneurs: Acquire knowledge of financial modeling techniques employed by leading biotech firms.
- Educators: Implement it as a pedagogical resource to illustrate valuation methodologies.
What the Template Contains
- Pre-Filled DCF Model: Immunocore's financial data preloaded for immediate use.
- WACC Calculator: Detailed calculations for Weighted Average Cost of Capital.
- Financial Ratios: Evaluate Immunocore's profitability, leverage, and efficiency.
- Editable Inputs: Change assumptions such as growth, margins, and CAPEX to fit your scenarios.
- Financial Statements: Annual and quarterly reports to support detailed analysis.
- Interactive Dashboard: Easily visualize key valuation metrics and results.
Disclaimer
All information, articles, and product details provided on this website are for general informational and educational purposes only. We do not claim any ownership over, nor do we intend to infringe upon, any trademarks, copyrights, logos, brand names, or other intellectual property mentioned or depicted on this site. Such intellectual property remains the property of its respective owners, and any references here are made solely for identification or informational purposes, without implying any affiliation, endorsement, or partnership.
We make no representations or warranties, express or implied, regarding the accuracy, completeness, or suitability of any content or products presented. Nothing on this website should be construed as legal, tax, investment, financial, medical, or other professional advice. In addition, no part of this site—including articles or product references—constitutes a solicitation, recommendation, endorsement, advertisement, or offer to buy or sell any securities, franchises, or other financial instruments, particularly in jurisdictions where such activity would be unlawful.
All content is of a general nature and may not address the specific circumstances of any individual or entity. It is not a substitute for professional advice or services. Any actions you take based on the information provided here are strictly at your own risk. You accept full responsibility for any decisions or outcomes arising from your use of this website and agree to release us from any liability in connection with your use of, or reliance upon, the content or products found herein.