
|
Indivior Plc (Indv.l) DCF -Bewertung |
Fully Editable: Tailor To Your Needs In Excel Or Sheets
Professional Design: Trusted, Industry-Standard Templates
Investor-Approved Valuation Models
MAC/PC Compatible, Fully Unlocked
No Expertise Is Needed; Easy To Follow
Indivior PLC (INDV.L) Bundle
Unser DCF-Taschenrechner für Indivior PLC (INDVL) für Genauigkeit ermöglicht es Ihnen, die Bewertung von Indivior PLC mithilfe realer Finanzdaten zu bewerten und vollständige Flexibilität zu bieten, um alle wesentlichen Parameter für verbesserte Projektionen zu ändern.
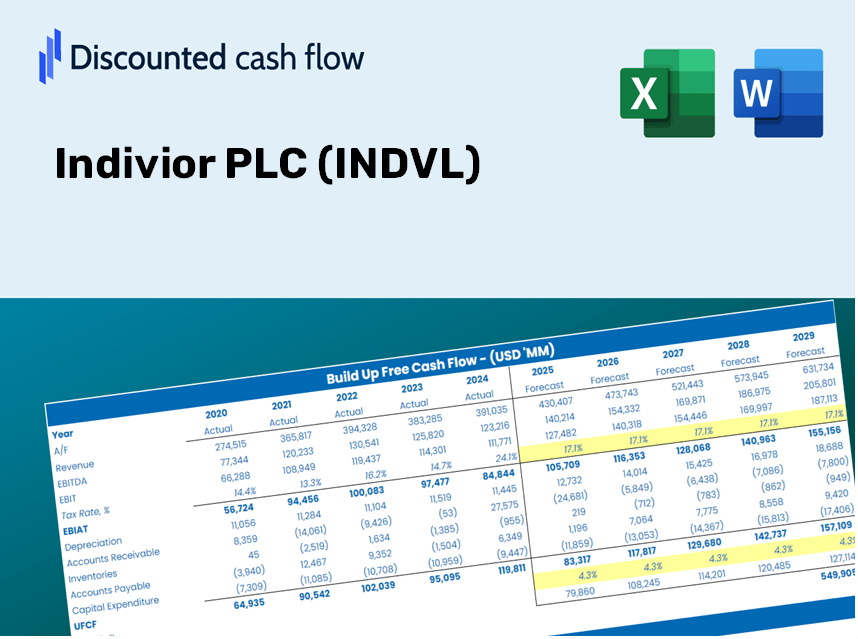
Discounted Cash Flow (DCF) - (USD MM)
| Year | AY1 2020 |
AY2 2021 |
AY3 2022 |
AY4 2023 |
AY5 2024 |
FY1 2025 |
FY2 2026 |
FY3 2027 |
FY4 2028 |
FY5 2029 |
|---|---|---|---|---|---|---|---|---|---|---|
| Revenue | 479.5 | 586.2 | 667.7 | 810.0 | 880.4 | 1,026.0 | 1,195.8 | 1,393.6 | 1,624.1 | 1,892.7 |
| Revenue Growth, % | 0 | 22.26 | 13.91 | 21.31 | 8.69 | 16.54 | 16.54 | 16.54 | 16.54 | 16.54 |
| EBITDA | -91.2 | 176.4 | -33.3 | 48.9 | 62.3 | 39.4 | 45.9 | 53.5 | 62.3 | 72.7 |
| EBITDA, % | -19.01 | 30.09 | -4.99 | 6.04 | 7.07 | 3.84 | 3.84 | 3.84 | 3.84 | 3.84 |
| Depreciation | 19.3 | 16.3 | 15.6 | 20.8 | 21.5 | 29.0 | 33.8 | 39.4 | 45.9 | 53.5 |
| Depreciation, % | 4.02 | 2.78 | 2.33 | 2.56 | 2.44 | 2.83 | 2.83 | 2.83 | 2.83 | 2.83 |
| EBIT | -110.4 | 160.1 | -48.9 | 28.2 | 40.8 | 10.4 | 12.1 | 14.1 | 16.4 | 19.2 |
| EBIT, % | -23.03 | 27.31 | -7.33 | 3.48 | 4.63 | 1.01 | 1.01 | 1.01 | 1.01 | 1.01 |
| Total Cash | 635.9 | 816.7 | 661.8 | 303.8 | 237.1 | 746.1 | 869.5 | 1,013.3 | 1,180.9 | 1,376.2 |
| Total Cash, percent | .0 | .0 | .0 | .0 | .0 | .0 | .0 | .0 | .0 | .0 |
| Account Receivables | 132.7 | 149.7 | 163.0 | 188.2 | 188.2 | 250.8 | 292.3 | 340.7 | 397.0 | 462.7 |
| Account Receivables, % | 27.67 | 25.54 | 24.42 | 23.24 | 21.38 | 24.45 | 24.45 | 24.45 | 24.45 | 24.45 |
| Inventories | 68.9 | 70.4 | 84.5 | 105.2 | 131.9 | 137.5 | 160.3 | 186.8 | 217.7 | 253.7 |
| Inventories, % | 14.37 | 12.01 | 12.65 | 12.99 | 14.98 | 13.4 | 13.4 | 13.4 | 13.4 | 13.4 |
| Accounts Payable | 14.8 | 19.3 | 24.5 | 28.9 | 46.7 | 38.8 | 45.2 | 52.7 | 61.4 | 71.6 |
| Accounts Payable, % | 3.09 | 3.29 | 3.66 | 3.57 | 5.3 | 3.78 | 3.78 | 3.78 | 3.78 | 3.78 |
| Capital Expenditure | -3.0 | -25.2 | -4.4 | -39.3 | -23.0 | -26.8 | -31.2 | -36.3 | -42.4 | -49.4 |
| Capital Expenditure, % | -0.61824 | -4.3 | -0.66593 | -4.85 | -2.61 | -2.61 | -2.61 | -2.61 | -2.61 | -2.61 |
| Tax Rate, % | 85.71 | 85.71 | 85.71 | 85.71 | 85.71 | 85.71 | 85.71 | 85.71 | 85.71 | 85.71 |
| EBITAT | -94.5 | 172.7 | -27.3 | 56.3 | 5.8 | 7.4 | 8.6 | 10.0 | 11.7 | 13.6 |
| Depreciation | ||||||||||
| Changes in Account Receivables | ||||||||||
| Changes in Inventories | ||||||||||
| Changes in Accounts Payable | ||||||||||
| Capital Expenditure | ||||||||||
| UFCF | -264.9 | 149.7 | -38.4 | -3.7 | -4.6 | -66.5 | -46.6 | -54.3 | -63.3 | -73.8 |
| WACC, % | 5.77 | 6 | 5.3 | 6 | 4.65 | 5.54 | 5.54 | 5.54 | 5.54 | 5.54 |
| PV UFCF | ||||||||||
| SUM PV UFCF | -258.3 | |||||||||
| Long Term Growth Rate, % | 2.00 | |||||||||
| Free cash flow (T + 1) | -75 | |||||||||
| Terminal Value | -2,123 | |||||||||
| Present Terminal Value | -1,621 | |||||||||
| Enterprise Value | -1,879 | |||||||||
| Net Debt | 42 | |||||||||
| Equity Value | -1,921 | |||||||||
| Diluted Shares Outstanding, MM | 133 | |||||||||
| Equity Value Per Share | -1,444.04 |
What You Will Receive
- Genuine INDVL Financials: Offers both historical and projected data for precise valuation.
- Customizable Inputs: Adjust WACC, tax rates, revenue growth, and capital expenditures as needed.
- Automated Calculations: Intrinsic value and NPV are calculated in real-time.
- Scenario Analysis: Explore various scenarios to assess Indivior's future performance.
- User-Friendly Design: Tailored for professionals while remaining accessible to newcomers.
Key Features
- Accurate Indivior Financials: Access reliable pre-loaded historical data and future forecasts for Indivior PLC (INDVL).
- Flexible Forecast Assumptions: Modify highlighted cells, including WACC, growth rates, and profit margins.
- Real-Time Calculations: Automatic updates for DCF, Net Present Value (NPV), and cash flow analysis.
- Intuitive Visual Dashboard: User-friendly charts and summaries for easy visualization of your valuation outcomes.
- Designed for All Skill Levels: A straightforward and intuitive layout tailored for investors, CFOs, and consultants alike.
How It Operates
- Step 1: Download the Excel file.
- Step 2: Examine the pre-filled data for Indivior PLC (INDVL) that includes both historical and projected figures.
- Step 3: Modify the key assumptions (highlighted in yellow) based on your insights.
- Step 4: Observe the automatic recalculations reflecting Indivior PLC’s (INDVL) intrinsic value.
- Step 5: Utilize the results for investment choices or reporting purposes.
Why Choose This Calculator for Indivior PLC (INDVL)?
- Designed for Experts: A specialized tool favored by analysts, CFOs, and industry consultants.
- Accurate Financials: Indivior’s historical and projected financial data preloaded for precise calculations.
- Flexible Scenario Analysis: Effortlessly simulate various forecasts and assumptions.
- Insightful Outputs: Automatically computes intrinsic value, NPV, and essential metrics.
- User-Friendly: Comprehensive, step-by-step instructions facilitate a smooth experience.
Who Can Benefit from This Product?
- Investors: Evaluate Indivior PLC's (INDVL) valuation before making stock trades.
- CFOs and Financial Analysts: Enhance the efficiency of valuation methods and validate forecasts.
- Startup Founders: Understand how leading public companies like Indivior PLC (INDVL) are appraised.
- Consultants: Provide comprehensive valuation reports for your clients.
- Students and Educators: Utilize authentic data to practice and teach valuation strategies.
Contents of the Template
- Pre-Populated Data: Contains Indivior PLC’s historical financial performance and projections.
- Discounted Cash Flow Model: An editable DCF valuation model featuring automatic computations.
- Weighted Average Cost of Capital (WACC): A specific sheet designed for WACC calculations using tailored inputs.
- Essential Financial Ratios: Examine Indivior PLC’s profitability, efficiency, and leverage.
- Custom Input Options: Easily modify revenue growth, profit margins, and tax rates.
- Comprehensive Dashboard: Visuals and tables encapsulating key valuation outcomes.
Disclaimer
All information, articles, and product details provided on this website are for general informational and educational purposes only. We do not claim any ownership over, nor do we intend to infringe upon, any trademarks, copyrights, logos, brand names, or other intellectual property mentioned or depicted on this site. Such intellectual property remains the property of its respective owners, and any references here are made solely for identification or informational purposes, without implying any affiliation, endorsement, or partnership.
We make no representations or warranties, express or implied, regarding the accuracy, completeness, or suitability of any content or products presented. Nothing on this website should be construed as legal, tax, investment, financial, medical, or other professional advice. In addition, no part of this site—including articles or product references—constitutes a solicitation, recommendation, endorsement, advertisement, or offer to buy or sell any securities, franchises, or other financial instruments, particularly in jurisdictions where such activity would be unlawful.
All content is of a general nature and may not address the specific circumstances of any individual or entity. It is not a substitute for professional advice or services. Any actions you take based on the information provided here are strictly at your own risk. You accept full responsibility for any decisions or outcomes arising from your use of this website and agree to release us from any liability in connection with your use of, or reliance upon, the content or products found herein.