
|
Innovage Holding Corp. (INNV) DCF -Bewertung |
Fully Editable: Tailor To Your Needs In Excel Or Sheets
Professional Design: Trusted, Industry-Standard Templates
Investor-Approved Valuation Models
MAC/PC Compatible, Fully Unlocked
No Expertise Is Needed; Easy To Follow
InnovAge Holding Corp. (INNV) Bundle
Entdecken Sie den tatsächlichen Wert von Innovage Holding Corp. (INNV) mit unserem DCF-Taschenrechner von Professional Grade! Passen Sie die wichtigsten Annahmen an, erkunden Sie verschiedene Szenarien und bewerten Sie, wie sich Änderungen auf die Bewertung von Innovage auswirken - alles innerhalb einer einzigen Excel -Vorlage.
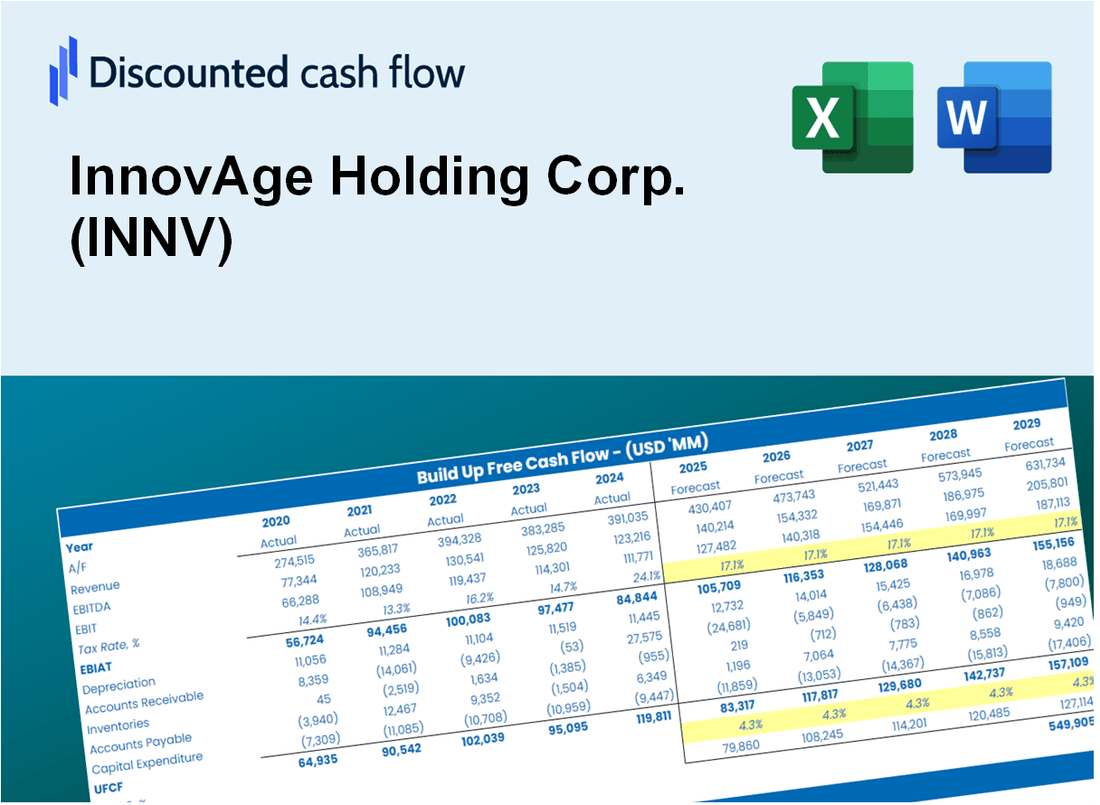
Discounted Cash Flow (DCF) - (USD MM)
| Year | AY1 2021 |
AY2 2022 |
AY3 2023 |
AY4 2024 |
AY5 2025 |
FY1 2026 |
FY2 2027 |
FY3 2028 |
FY4 2029 |
FY5 2030 |
|---|---|---|---|---|---|---|---|---|---|---|
| Revenue | 637.8 | 698.6 | 688.1 | 763.9 | 853.7 | 919.4 | 990.2 | 1,066.5 | 1,148.6 | 1,237.1 |
| Revenue Growth, % | 0 | 9.54 | -1.51 | 11.01 | 11.76 | 7.7 | 7.7 | 7.7 | 7.7 | 7.7 |
| EBITDA | -5.9 | 9.2 | -33.9 | 1.2 | 3.4 | -7.3 | -7.9 | -8.5 | -9.1 | -9.8 |
| EBITDA, % | -0.92317 | 1.32 | -4.92 | 0.15108 | 0.39405 | -0.79581 | -0.79581 | -0.79581 | -0.79581 | -0.79581 |
| Depreciation | 12.3 | 13.9 | 15.4 | 19.0 | 19.5 | 20.1 | 21.6 | 23.3 | 25.1 | 27.0 |
| Depreciation, % | 1.93 | 1.99 | 2.24 | 2.48 | 2.29 | 2.19 | 2.19 | 2.19 | 2.19 | 2.19 |
| EBIT | -18.2 | -4.7 | -49.3 | -17.8 | -16.1 | -27.4 | -29.5 | -31.8 | -34.2 | -36.9 |
| EBIT, % | -2.85 | -0.67431 | -7.16 | -2.33 | -1.89 | -2.98 | -2.98 | -2.98 | -2.98 | -2.98 |
| Total Cash | 201.5 | 184.4 | 173.5 | 102.8 | 105.9 | 200.5 | 216.0 | 232.6 | 250.5 | 269.8 |
| Total Cash, percent | .0 | .0 | .0 | .0 | .0 | .0 | .0 | .0 | .0 | .0 |
| Account Receivables | 38.0 | 42.7 | 24.6 | 51.4 | 36.4 | 49.0 | 52.7 | 56.8 | 61.2 | 65.9 |
| Account Receivables, % | 5.96 | 6.11 | 3.58 | 6.73 | 4.26 | 5.33 | 5.33 | 5.33 | 5.33 | 5.33 |
| Inventories | 2.2 | .0 | -.3 | .0 | .0 | .6 | .6 | .7 | .7 | .8 |
| Inventories, % | 0.35027 | 0 | -0.03807658 | 0 | 0 | 0.06243799 | 0.06243799 | 0.06243799 | 0.06243799 | 0.06243799 |
| Accounts Payable | 32.4 | 50.6 | 44.6 | 55.5 | 76.8 | 64.4 | 69.4 | 74.7 | 80.5 | 86.7 |
| Accounts Payable, % | 5.07 | 7.24 | 6.48 | 7.26 | 8.99 | 7.01 | 7.01 | 7.01 | 7.01 | 7.01 |
| Capital Expenditure | -19.5 | -38.2 | -23.4 | -7.9 | -6.3 | -25.2 | -27.1 | -29.2 | -31.5 | -33.9 |
| Capital Expenditure, % | -3.06 | -5.47 | -3.39 | -1.04 | -0.73363 | -2.74 | -2.74 | -2.74 | -2.74 | -2.74 |
| Tax Rate, % | 10.91 | 10.91 | 10.91 | 10.91 | 10.91 | 10.91 | 10.91 | 10.91 | 10.91 | 10.91 |
| EBITAT | -23.3 | -5.2 | -39.5 | -17.4 | -14.4 | -25.6 | -27.6 | -29.7 | -32.0 | -34.4 |
| Depreciation | ||||||||||
| Changes in Account Receivables | ||||||||||
| Changes in Inventories | ||||||||||
| Changes in Accounts Payable | ||||||||||
| Capital Expenditure | ||||||||||
| UFCF | -38.4 | -13.7 | -35.1 | -22.6 | 35.2 | -56.2 | -31.9 | -34.4 | -37.0 | -39.9 |
| WACC, % | 6.17 | 6.17 | 6.08 | 6.16 | 6.12 | 6.14 | 6.14 | 6.14 | 6.14 | 6.14 |
| PV UFCF | ||||||||||
| SUM PV UFCF | -168.8 | |||||||||
| Long Term Growth Rate, % | 2.00 | |||||||||
| Free cash flow (T + 1) | -41 | |||||||||
| Terminal Value | -982 | |||||||||
| Present Terminal Value | -729 | |||||||||
| Enterprise Value | -897 | |||||||||
| Net Debt | -21 | |||||||||
| Equity Value | -877 | |||||||||
| Diluted Shares Outstanding, MM | 135 | |||||||||
| Equity Value Per Share | -6.48 |
What You Will Get
- Editable Excel Template: A fully customizable Excel-based DCF Calculator featuring pre-filled real InnovAge Holding Corp. (INNV) financials.
- Real-World Data: Historical data and forward-looking estimates (as indicated in the highlighted cells).
- Forecast Flexibility: Adjust forecast assumptions such as revenue growth, EBITDA %, and WACC.
- Automatic Calculations: Instantly observe the effects of your inputs on InnovAge Holding Corp.'s (INNV) valuation.
- Professional Tool: Designed for investors, CFOs, consultants, and financial analysts.
- User-Friendly Design: Organized for clarity and ease of use, complete with step-by-step instructions.
Key Features
- 🔍 Real-Life INNV Financials: Pre-filled historical and projected data for InnovAge Holding Corp.
- ✏️ Fully Customizable Inputs: Adjust all critical parameters (yellow cells) like WACC, growth %, and tax rates.
- 📊 Professional DCF Valuation: Built-in formulas calculate InnovAge’s intrinsic value using the Discounted Cash Flow method.
- ⚡ Instant Results: Visualize InnovAge’s valuation instantly after making changes.
- Scenario Analysis: Test and compare outcomes for various financial assumptions side-by-side.
How It Works
- Step 1: Download the Excel file.
- Step 2: Review InnovAge Holding Corp.'s (INNV) pre-filled financial data and forecasts.
- Step 3: Adjust key inputs such as revenue growth, WACC, and tax rates (highlighted cells).
- Step 4: Observe the DCF model update in real-time as you modify your assumptions.
- Step 5: Evaluate the outputs and leverage the results for your investment strategies.
Why Choose This Calculator for InnovAge Holding Corp. (INNV)?
- Accuracy: Utilizes real InnovAge financials to ensure precise data.
- Flexibility: Tailored for users to easily test and adjust inputs as needed.
- Time-Saving: Eliminate the complexity of constructing a DCF model from the ground up.
- Professional-Grade: Crafted with the precision and usability expected by CFOs.
- User-Friendly: Simple to navigate, even for individuals without extensive financial modeling skills.
Who Should Use InnovAge Holding Corp. (INNV)?
- Healthcare Investors: Make informed investment choices with a comprehensive analysis of InnovAge's market position.
- Financial Analysts: Streamline your workflow with an adaptable financial model tailored for InnovAge's unique business structure.
- Consultants: Effortlessly modify the framework for client briefings or strategic reports focused on InnovAge's services.
- Healthcare Enthusiasts: Enhance your knowledge of the senior care market through practical insights and examples from InnovAge.
- Educators and Students: Leverage it as a valuable resource for teaching and learning about healthcare finance and business operations.
What the Template Contains
- Comprehensive DCF Model: Editable template featuring detailed valuation calculations.
- Real-World Data: InnovAge Holding Corp.’s (INNV) historical and projected financials preloaded for analysis.
- Customizable Parameters: Modify WACC, growth rates, and tax assumptions to explore various scenarios.
- Financial Statements: Complete annual and quarterly breakdowns for enhanced insights.
- Key Ratios: Integrated analysis for profitability, efficiency, and leverage metrics.
- Dashboard with Visual Outputs: Charts and tables providing clear, actionable results.
Disclaimer
All information, articles, and product details provided on this website are for general informational and educational purposes only. We do not claim any ownership over, nor do we intend to infringe upon, any trademarks, copyrights, logos, brand names, or other intellectual property mentioned or depicted on this site. Such intellectual property remains the property of its respective owners, and any references here are made solely for identification or informational purposes, without implying any affiliation, endorsement, or partnership.
We make no representations or warranties, express or implied, regarding the accuracy, completeness, or suitability of any content or products presented. Nothing on this website should be construed as legal, tax, investment, financial, medical, or other professional advice. In addition, no part of this site—including articles or product references—constitutes a solicitation, recommendation, endorsement, advertisement, or offer to buy or sell any securities, franchises, or other financial instruments, particularly in jurisdictions where such activity would be unlawful.
All content is of a general nature and may not address the specific circumstances of any individual or entity. It is not a substitute for professional advice or services. Any actions you take based on the information provided here are strictly at your own risk. You accept full responsibility for any decisions or outcomes arising from your use of this website and agree to release us from any liability in connection with your use of, or reliance upon, the content or products found herein.