
|
Innoviva, Inc. (INVA) DCF -Bewertung |
Fully Editable: Tailor To Your Needs In Excel Or Sheets
Professional Design: Trusted, Industry-Standard Templates
Investor-Approved Valuation Models
MAC/PC Compatible, Fully Unlocked
No Expertise Is Needed; Easy To Follow
Innoviva, Inc. (INVA) Bundle
Erforschen Sie die finanzielle Zukunft von Innoviva, Inc. (Inva) mit unserem benutzerfreundlichen DCF-Taschenrechner! Geben Sie Ihre Annahmen für Wachstum, Margen und Kosten für die Berechnung von Innoviva, Inc. (Inva) ein und informieren Sie Ihren Investitionsansatz.
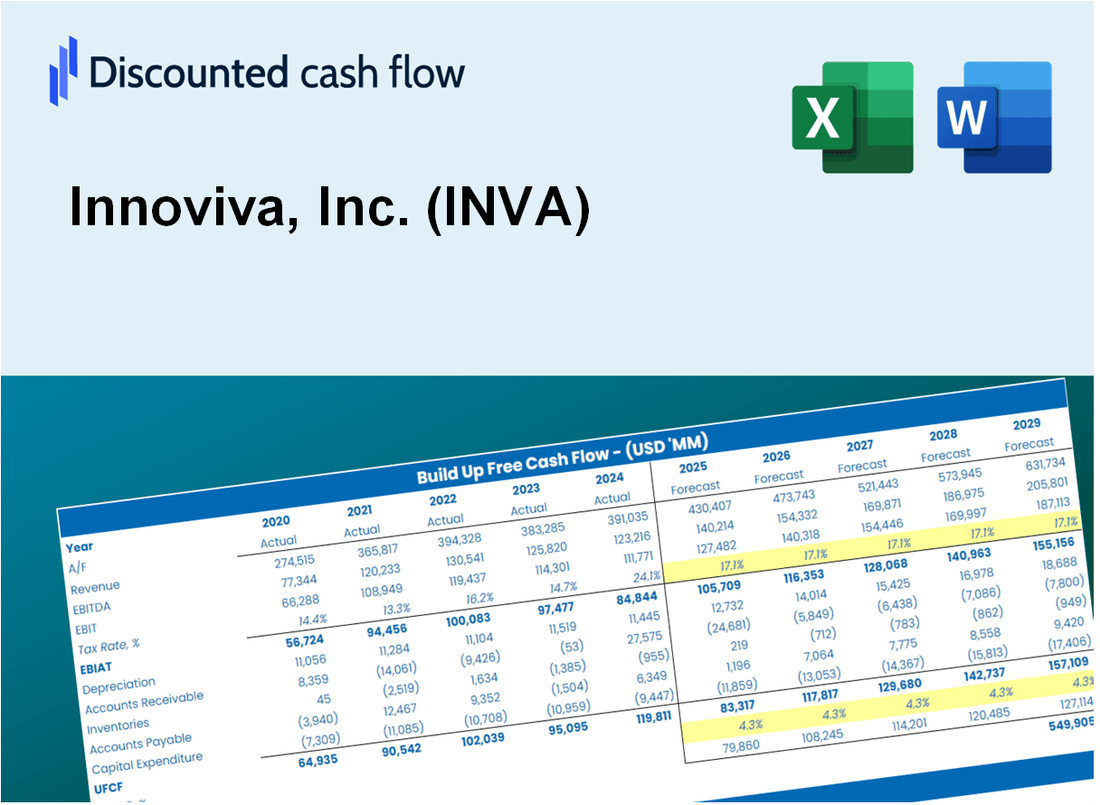
Discounted Cash Flow (DCF) - (USD MM)
| Year | AY1 2020 |
AY2 2021 |
AY3 2022 |
AY4 2023 |
AY5 2024 |
FY1 2025 |
FY2 2026 |
FY3 2027 |
FY4 2028 |
FY5 2029 |
|---|---|---|---|---|---|---|---|---|---|---|
| Revenue | 336.8 | 391.9 | 331.3 | 310.5 | 358.7 | 367.8 | 377.1 | 386.7 | 396.5 | 406.6 |
| Revenue Growth, % | 0 | 16.35 | -15.45 | -6.3 | 15.54 | 2.54 | 2.54 | 2.54 | 2.54 | 2.54 |
| EBITDA | 372.6 | 464.3 | 308.3 | 235.0 | 85.5 | 288.8 | 296.1 | 303.6 | 311.3 | 319.2 |
| EBITDA, % | 110.62 | 118.5 | 93.05 | 75.71 | 23.84 | 78.52 | 78.52 | 78.52 | 78.52 | 78.52 |
| Depreciation | .0 | .0 | 5.6 | 21.8 | 25.9 | 11.7 | 12.0 | 12.3 | 12.6 | 12.9 |
| Depreciation, % | 0 | 0 | 1.68 | 7.02 | 7.22 | 3.18 | 3.18 | 3.18 | 3.18 | 3.18 |
| EBIT | 372.6 | 464.3 | 302.7 | 213.3 | 59.6 | 277.1 | 284.1 | 291.3 | 298.7 | 306.3 |
| EBIT, % | 110.62 | 118.5 | 91.37 | 68.69 | 16.61 | 75.33 | 75.33 | 75.33 | 75.33 | 75.33 |
| Total Cash | 246.5 | 201.5 | 291.0 | 193.5 | 412.5 | 275.7 | 282.7 | 289.9 | 297.2 | 304.8 |
| Total Cash, percent | .0 | .0 | .0 | .0 | .0 | .0 | .0 | .0 | .0 | .0 |
| Account Receivables | 93.9 | 110.7 | 64.1 | 84.1 | 86.4 | 93.2 | 95.5 | 97.9 | 100.4 | 103.0 |
| Account Receivables, % | 27.89 | 28.25 | 19.34 | 27.08 | 24.08 | 25.33 | 25.33 | 25.33 | 25.33 | 25.33 |
| Inventories | .0 | .0 | 55.9 | 40.7 | 33.7 | 29.0 | 29.7 | 30.5 | 31.2 | 32.0 |
| Inventories, % | 0 | 0 | 16.87 | 13.12 | 9.4 | 7.88 | 7.88 | 7.88 | 7.88 | 7.88 |
| Accounts Payable | .1 | .0 | 2.9 | 6.7 | 2.1 | 2.7 | 2.8 | 2.8 | 2.9 | 3.0 |
| Accounts Payable, % | 0.01959655 | 0.00689011 | 0.88701 | 2.16 | 0.59435 | 0.73428 | 0.73428 | 0.73428 | 0.73428 | 0.73428 |
| Capital Expenditure | .0 | -1.3 | -.1 | -.4 | -.3 | -.4 | -.4 | -.4 | -.4 | -.5 |
| Capital Expenditure, % | -0.00385993 | -0.33277 | -0.02022098 | -0.13238 | -0.07526951 | -0.1129 | -0.1129 | -0.1129 | -0.1129 | -0.1129 |
| Tax Rate, % | 37.43 | 37.43 | 37.43 | 37.43 | 37.43 | 37.43 | 37.43 | 37.43 | 37.43 | 37.43 |
| EBITAT | 236.0 | 277.2 | 225.7 | 197.5 | 37.3 | 195.5 | 200.4 | 205.5 | 210.7 | 216.1 |
| Depreciation | ||||||||||
| Changes in Account Receivables | ||||||||||
| Changes in Inventories | ||||||||||
| Changes in Accounts Payable | ||||||||||
| Capital Expenditure | ||||||||||
| UFCF | 142.1 | 259.1 | 224.9 | 217.8 | 63.1 | 205.3 | 209.0 | 214.3 | 219.7 | 225.3 |
| WACC, % | 5.42 | 5.38 | 5.54 | 5.73 | 5.41 | 5.5 | 5.5 | 5.5 | 5.5 | 5.5 |
| PV UFCF | ||||||||||
| SUM PV UFCF | 914.8 | |||||||||
| Long Term Growth Rate, % | 0.50 | |||||||||
| Free cash flow (T + 1) | 226 | |||||||||
| Terminal Value | 4,533 | |||||||||
| Present Terminal Value | 3,469 | |||||||||
| Enterprise Value | 4,384 | |||||||||
| Net Debt | 146 | |||||||||
| Equity Value | 4,238 | |||||||||
| Diluted Shares Outstanding, MM | 74 | |||||||||
| Equity Value Per Share | 57.12 |
What You Will Receive
- Pre-Filled Financial Model: Innoviva’s actual data facilitates accurate DCF valuation.
- Full Forecast Control: Modify revenue growth, profit margins, WACC, and other critical drivers.
- Instant Calculations: Automatic updates provide immediate feedback as you adjust parameters.
- Investor-Ready Template: A polished Excel file crafted for high-quality valuation presentations.
- Customizable and Reusable: Designed for versatility, allowing for repeated application in detailed forecasts.
Key Features
- Comprehensive Innoviva Financials: Gain access to precise pre-loaded historical data and future forecasts.
- Adjustable Forecast Parameters: Modify highlighted cells for metrics such as WACC, growth rates, and profit margins.
- Real-Time Calculations: Automatic updates for DCF, Net Present Value (NPV), and cash flow assessments.
- Interactive Dashboard: User-friendly charts and summaries to help visualize your valuation outcomes.
- Suitable for All Levels: A straightforward, intuitive design tailored for investors, CFOs, and consultants alike.
How It Works
- Download: Obtain the pre-built Excel file containing Innoviva, Inc.'s (INVA) financial data.
- Customize: Modify projections, such as revenue growth, EBITDA %, and WACC.
- Update Automatically: The intrinsic value and NPV calculations refresh in real-time.
- Test Scenarios: Generate various forecasts and analyze results instantly.
- Make Decisions: Utilize the valuation outcomes to inform your investment choices.
Why Choose Innoviva, Inc. (INVA) Calculator?
- Save Time: Skip the hassle of building a model from the ground up – it's ready for immediate use.
- Enhance Accuracy: Dependable financial data and established formulas minimize valuation errors.
- Completely Customizable: Adjust the model to align with your unique assumptions and forecasts.
- User-Friendly: Intuitive charts and outputs facilitate easy result interpretation.
- Endorsed by Professionals: Crafted for experts who prioritize both precision and functionality.
Who Should Use Innoviva, Inc. (INVA)?
- Investors: Gain insights and make informed decisions with cutting-edge research on Innoviva's market potential.
- Financial Analysts: Utilize comprehensive data and analytics to evaluate Innoviva's performance and prospects.
- Consultants: Tailor reports and presentations for clients by leveraging Innoviva's strategic initiatives and developments.
- Healthcare Professionals: Enhance your understanding of Innoviva's impact on the pharmaceutical landscape and patient care.
- Students and Educators: Explore real-world case studies of Innoviva to enrich finance and healthcare education.
What the Template Contains
- Pre-Filled DCF Model: Innoviva, Inc.’s (INVA) financial data preloaded for immediate use.
- WACC Calculator: Detailed calculations for Weighted Average Cost of Capital.
- Financial Ratios: Evaluate Innoviva, Inc.’s (INVA) profitability, leverage, and efficiency.
- Editable Inputs: Change assumptions such as growth, margins, and CAPEX to fit your scenarios.
- Financial Statements: Annual and quarterly reports to support detailed analysis.
- Interactive Dashboard: Easily visualize key valuation metrics and results.
Disclaimer
All information, articles, and product details provided on this website are for general informational and educational purposes only. We do not claim any ownership over, nor do we intend to infringe upon, any trademarks, copyrights, logos, brand names, or other intellectual property mentioned or depicted on this site. Such intellectual property remains the property of its respective owners, and any references here are made solely for identification or informational purposes, without implying any affiliation, endorsement, or partnership.
We make no representations or warranties, express or implied, regarding the accuracy, completeness, or suitability of any content or products presented. Nothing on this website should be construed as legal, tax, investment, financial, medical, or other professional advice. In addition, no part of this site—including articles or product references—constitutes a solicitation, recommendation, endorsement, advertisement, or offer to buy or sell any securities, franchises, or other financial instruments, particularly in jurisdictions where such activity would be unlawful.
All content is of a general nature and may not address the specific circumstances of any individual or entity. It is not a substitute for professional advice or services. Any actions you take based on the information provided here are strictly at your own risk. You accept full responsibility for any decisions or outcomes arising from your use of this website and agree to release us from any liability in connection with your use of, or reliance upon, the content or products found herein.