
|
Innoviz Technologies Ltd. (INVZ) DCF -Bewertung |
Fully Editable: Tailor To Your Needs In Excel Or Sheets
Professional Design: Trusted, Industry-Standard Templates
Investor-Approved Valuation Models
MAC/PC Compatible, Fully Unlocked
No Expertise Is Needed; Easy To Follow
Innoviz Technologies Ltd. (INVZ) Bundle
Unser (INVZ) DCF-Taschenrechner entwickelt für die Genauigkeit und ermöglicht die Bewertung von Innoviz Technologies Ltd., mithilfe von Finanzdaten mit realer Welt, mit der Flexibilität, alle wesentlichen Parameter für verbesserte Projektionen zu ändern.
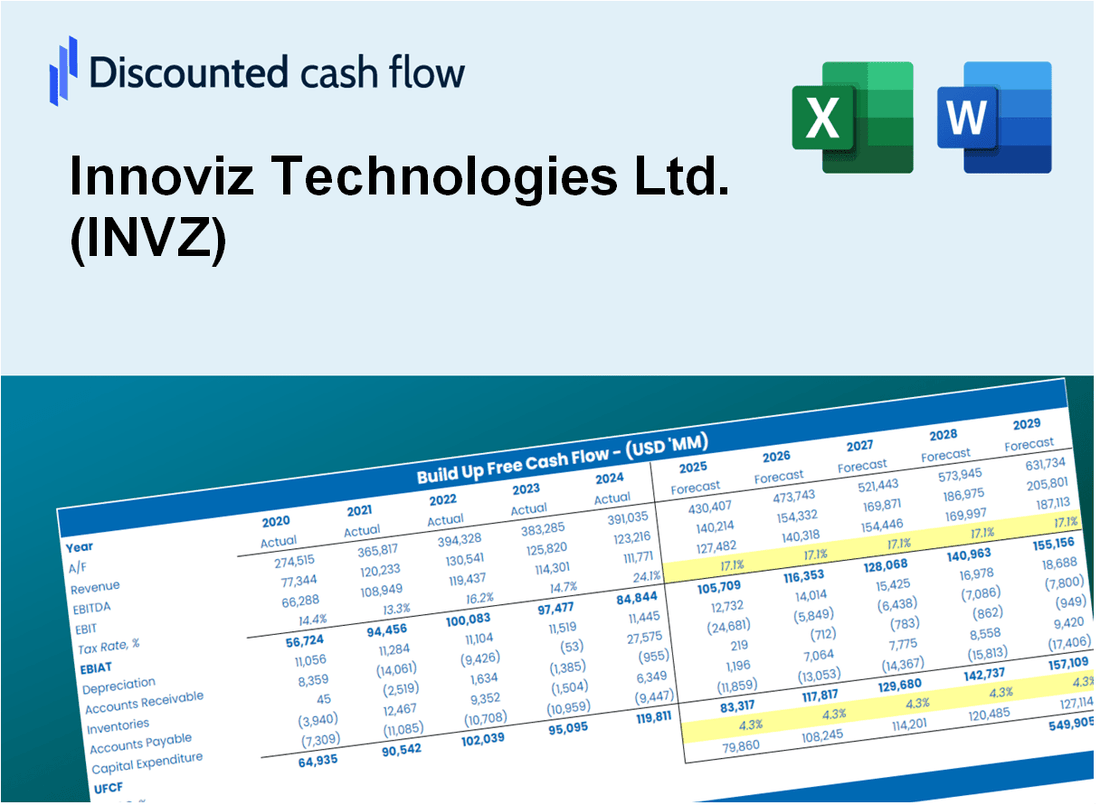
Discounted Cash Flow (DCF) - (USD MM)
| Year | AY1 2020 |
AY2 2021 |
AY3 2022 |
AY4 2023 |
AY5 2024 |
FY1 2025 |
FY2 2026 |
FY3 2027 |
FY4 2028 |
FY5 2029 |
|---|---|---|---|---|---|---|---|---|---|---|
| Revenue | -9.4 | 5.5 | 6.0 | 20.9 | 24.3 | 25.9 | 27.6 | 29.4 | 31.4 | 33.4 |
| Revenue Growth, % | 0 | -158.37 | 10.25 | 246.43 | 16.25 | 6.62 | 6.62 | 6.62 | 6.62 | 6.62 |
| EBITDA | -79.3 | -153.7 | -125.9 | -123.4 | -94.1 | -15.5 | -16.6 | -17.6 | -18.8 | -20.1 |
| EBITDA, % | 847.1 | -2811.8 | -2088.9 | -591.16 | -387.89 | -60 | -60 | -60 | -60 | -60 |
| Depreciation | 2.7 | 4.0 | 7.5 | 9.2 | 7.8 | 11.4 | 12.1 | 13.0 | 13.8 | 14.7 |
| Depreciation, % | -28.42 | 72.45 | 124 | 44.03 | 32.08 | 44.03 | 44.03 | 44.03 | 44.03 | 44.03 |
| EBIT | -82.0 | -157.7 | -133.3 | -132.6 | -101.9 | -15.5 | -16.6 | -17.6 | -18.8 | -20.1 |
| EBIT, % | 875.51 | -2884.25 | -2212.89 | -635.19 | -419.97 | -60 | -60 | -60 | -60 | -60 |
| Total Cash | 50.0 | 265.7 | 178.1 | 145.4 | 67.9 | 15.5 | 16.6 | 17.6 | 18.8 | 20.1 |
| Total Cash, percent | .0 | .0 | .0 | .0 | .0 | .0 | .0 | .0 | .0 | .0 |
| Account Receivables | 2.5 | .9 | 2.4 | 7.4 | 6.2 | 4.7 | 5.0 | 5.3 | 5.6 | 6.0 |
| Account Receivables, % | -26.76 | 16.48 | 39.41 | 35.42 | 25.35 | 17.98 | 17.98 | 17.98 | 17.98 | 17.98 |
| Inventories | 2.2 | 4.3 | 4.2 | 1.9 | 1.9 | 7.3 | 7.8 | 8.3 | 8.9 | 9.5 |
| Inventories, % | -23.11 | 77.86 | 70.3 | 8.95 | 7.85 | 28.37 | 28.37 | 28.37 | 28.37 | 28.37 |
| Accounts Payable | 7.8 | 5.8 | 8.4 | 8.0 | 8.8 | 9.9 | 10.6 | 11.3 | 12.0 | 12.8 |
| Accounts Payable, % | -82.77 | 105.45 | 138.85 | 38.49 | 36.32 | 38.41 | 38.41 | 38.41 | 38.41 | 38.41 |
| Capital Expenditure | -5.1 | -3.8 | -22.6 | -6.6 | -4.4 | -11.3 | -12.1 | -12.9 | -13.7 | -14.6 |
| Capital Expenditure, % | 54.68 | -69.23 | -374.49 | -31.51 | -18.18 | -43.78 | -43.78 | -43.78 | -43.78 | -43.78 |
| Tax Rate, % | -0.17655 | -0.17655 | -0.17655 | -0.17655 | -0.17655 | -0.17655 | -0.17655 | -0.17655 | -0.17655 | -0.17655 |
| EBITAT | -82.2 | -157.9 | -133.7 | -133.3 | -102.1 | -15.5 | -16.6 | -17.6 | -18.8 | -20.1 |
| Depreciation | ||||||||||
| Changes in Account Receivables | ||||||||||
| Changes in Inventories | ||||||||||
| Changes in Accounts Payable | ||||||||||
| Capital Expenditure | ||||||||||
| UFCF | -81.5 | -160.2 | -147.6 | -133.7 | -96.7 | -18.3 | -16.6 | -17.7 | -18.9 | -20.1 |
| WACC, % | 9.65 | 9.65 | 9.65 | 9.65 | 9.65 | 9.65 | 9.65 | 9.65 | 9.65 | 9.65 |
| PV UFCF | ||||||||||
| SUM PV UFCF | -69.7 | |||||||||
| Long Term Growth Rate, % | 2.00 | |||||||||
| Free cash flow (T + 1) | -21 | |||||||||
| Terminal Value | -269 | |||||||||
| Present Terminal Value | -170 | |||||||||
| Enterprise Value | -239 | |||||||||
| Net Debt | 4 | |||||||||
| Equity Value | -244 | |||||||||
| Diluted Shares Outstanding, MM | 221 | |||||||||
| Equity Value Per Share | -1.10 |
What You Will Receive
- Adjustable Forecast Parameters: Effortlessly modify assumptions (growth %, margins, WACC) to explore various scenarios.
- Industry-Specific Data: Innoviz’s financial data pre-loaded to facilitate your analysis.
- Automated DCF Calculations: The template computes Net Present Value (NPV) and intrinsic value automatically.
- Tailored and Professional Design: A sleek Excel model that conforms to your valuation requirements.
- Designed for Analysts and Investors: Perfect for evaluating projections, confirming strategies, and enhancing efficiency.
Key Features
- Accurate Market Data: Gain access to reliable pre-loaded historical performance metrics and future forecasts for Innoviz Technologies Ltd. (INVZ).
- Tailored Forecast Inputs: Modify highlighted fields such as WACC, growth rates, and profit margins to suit your analysis.
- Real-Time Calculations: Instant updates to DCF, Net Present Value (NPV), and cash flow assessments.
- Interactive Dashboard: User-friendly charts and summaries to effectively visualize your valuation findings.
- Suitable for All Skill Levels: An intuitive layout designed for investors, CFOs, and consultants alike.
How It Works
- Download the Template: Gain immediate access to the Excel-based INVZ DCF Calculator.
- Input Your Assumptions: Modify the yellow-highlighted cells for growth rates, WACC, margins, and additional variables.
- Instant Calculations: The model automatically recalculates Innoviz’s intrinsic value.
- Test Scenarios: Experiment with various assumptions to assess potential valuation shifts.
- Analyze and Decide: Utilize the findings to inform your investment or financial strategy.
Why Choose This Calculator?
- Accurate Data: Real Innoviz Technologies financials ensure reliable valuation results.
- Customizable: Adjust key parameters like growth rates, WACC, and tax rates to align with your forecasts.
- Time-Saving: Pre-built calculations save you the hassle of starting from scratch.
- Professional-Grade Tool: Tailored for investors, analysts, and consultants in the tech industry.
- User-Friendly: Intuitive design and step-by-step guidance make it accessible for all users.
Who Should Use This Product?
- Individual Investors: Make informed decisions about buying or selling Innoviz Technologies Ltd. (INVZ) stock.
- Financial Analysts: Streamline valuation processes with ready-to-use financial models for Innoviz Technologies Ltd. (INVZ).
- Consultants: Deliver professional valuation insights on Innoviz Technologies Ltd. (INVZ) to clients quickly and accurately.
- Business Owners: Understand how innovative companies like Innoviz Technologies Ltd. (INVZ) are valued to guide your own strategy.
- Finance Students: Learn valuation techniques using real-world data and scenarios related to Innoviz Technologies Ltd. (INVZ).
What the Template Contains
- Pre-Filled DCF Model: Innoviz Technologies' financial data preloaded for immediate use.
- WACC Calculator: Detailed calculations for Weighted Average Cost of Capital.
- Financial Ratios: Evaluate Innoviz's profitability, leverage, and efficiency.
- Editable Inputs: Change assumptions such as growth, margins, and CAPEX to fit your scenarios.
- Financial Statements: Annual and quarterly reports to support detailed analysis.
- Interactive Dashboard: Easily visualize key valuation metrics and results.
Disclaimer
All information, articles, and product details provided on this website are for general informational and educational purposes only. We do not claim any ownership over, nor do we intend to infringe upon, any trademarks, copyrights, logos, brand names, or other intellectual property mentioned or depicted on this site. Such intellectual property remains the property of its respective owners, and any references here are made solely for identification or informational purposes, without implying any affiliation, endorsement, or partnership.
We make no representations or warranties, express or implied, regarding the accuracy, completeness, or suitability of any content or products presented. Nothing on this website should be construed as legal, tax, investment, financial, medical, or other professional advice. In addition, no part of this site—including articles or product references—constitutes a solicitation, recommendation, endorsement, advertisement, or offer to buy or sell any securities, franchises, or other financial instruments, particularly in jurisdictions where such activity would be unlawful.
All content is of a general nature and may not address the specific circumstances of any individual or entity. It is not a substitute for professional advice or services. Any actions you take based on the information provided here are strictly at your own risk. You accept full responsibility for any decisions or outcomes arising from your use of this website and agree to release us from any liability in connection with your use of, or reliance upon, the content or products found herein.