
|
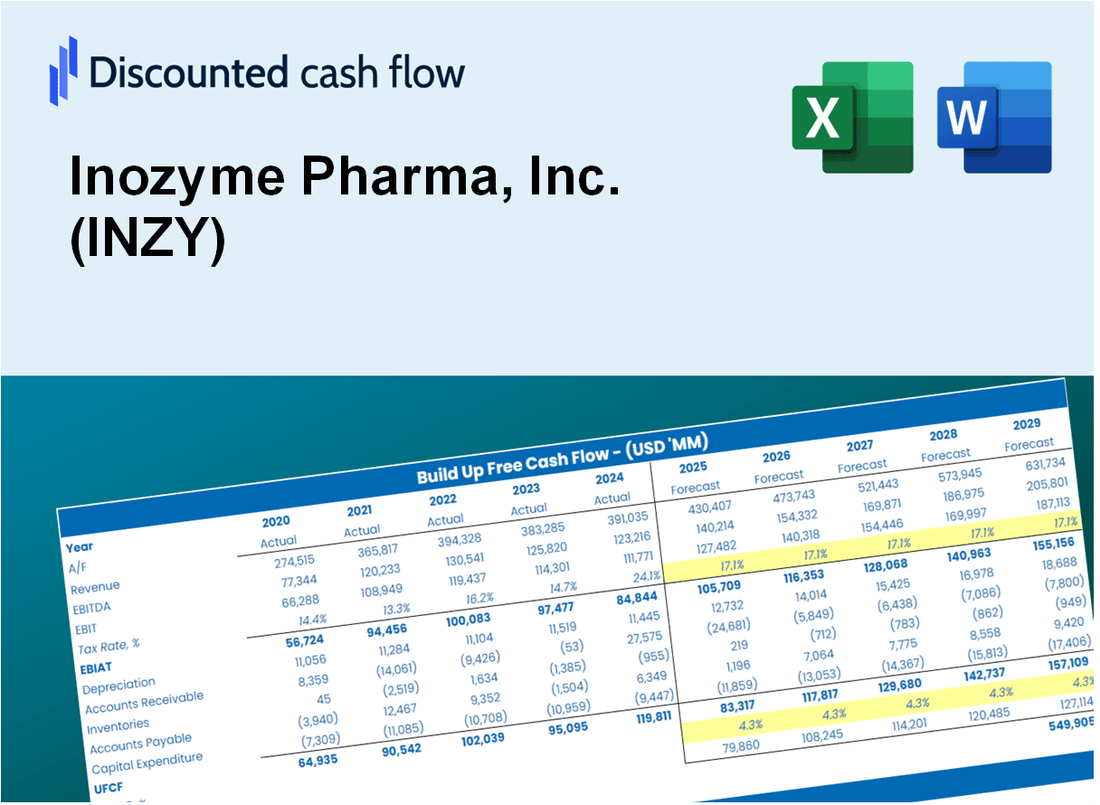
Inozyme Pharma, Inc. (inzy) DCF -Bewertung |
Fully Editable: Tailor To Your Needs In Excel Or Sheets
Professional Design: Trusted, Industry-Standard Templates
Investor-Approved Valuation Models
MAC/PC Compatible, Fully Unlocked
No Expertise Is Needed; Easy To Follow
Inozyme Pharma, Inc. (INZY) Bundle
Entdecken Sie das wahre Potenzial von Inozyme Pharma, Inc. (Inzy) mit unserem fortschrittlichen DCF -Taschenrechner! Passen Sie die wichtigsten Annahmen an, erkunden Sie verschiedene Szenarien und bewerten Sie, wie unterschiedliche Änderungen die Bewertung von Inozym Pharma beeinflussen - alles innerhalb einer einzigen Excel -Vorlage.
What You Will Get
- Real INZY Financial Data: Pre-filled with Inozyme Pharma’s historical and projected data for precise analysis.
- Fully Editable Template: Modify key inputs like revenue growth, WACC, and EBITDA % with ease.
- Automatic Calculations: See Inozyme Pharma’s intrinsic value update instantly based on your changes.
- Professional Valuation Tool: Designed for investors, analysts, and consultants seeking accurate DCF results.
- User-Friendly Design: Simple structure and clear instructions for all experience levels.
Key Features
- Accurate Inozyme Financials: Gain access to reliable pre-loaded historical data and future forecasts.
- Tailored Forecast Assumptions: Modify highlighted cells for key metrics like WACC, growth rates, and profit margins.
- Real-Time Calculations: Automatic updates for DCF, Net Present Value (NPV), and cash flow assessments.
- Interactive Dashboard: Clear charts and summaries to effectively visualize your valuation outcomes.
- Designed for All Users: A user-friendly layout suitable for investors, CFOs, and consultants alike.
How It Works
- Step 1: Download the Excel file for Inozyme Pharma, Inc. (INZY).
- Step 2: Review Inozyme’s pre-filled financial data and projections.
- Step 3: Adjust key inputs such as revenue growth, WACC, and tax rates (highlighted cells).
- Step 4: Observe the DCF model refresh in real-time as you modify your assumptions.
- Step 5: Evaluate the outputs and leverage the findings for your investment strategies.
Why Choose This Calculator for Inozyme Pharma, Inc. (INZY)?
- Comprehensive Tool: Integrates DCF, WACC, and financial ratio analyses tailored for Inozyme Pharma.
- Customizable Inputs: Modify the yellow-highlighted cells to explore different financial scenarios.
- Detailed Insights: Automatically computes Inozyme’s intrinsic value and Net Present Value.
- Preloaded Data: Historical and projected data provide a solid foundation for analysis.
- Professional Quality: Perfect for financial analysts, investors, and business consultants focused on Inozyme Pharma.
Who Should Use This Product?
- Biotechnology Students: Understand drug development processes and apply them using real-world data.
- Researchers: Integrate advanced models into academic studies or clinical research.
- Investors: Evaluate your investment strategies and analyze the market performance of Inozyme Pharma, Inc. (INZY).
- Analysts: Enhance your analysis with a customizable financial model tailored for biotech firms.
- Healthcare Entrepreneurs: Discover how large biotech companies like Inozyme Pharma, Inc. (INZY) are assessed in the market.
What the Template Contains
- Historical Data: Includes Inozyme Pharma, Inc.’s past financials and baseline forecasts.
- DCF and Levered DCF Models: Detailed templates to calculate Inozyme Pharma, Inc.'s intrinsic value.
- WACC Sheet: Pre-built calculations for Weighted Average Cost of Capital.
- Editable Inputs: Modify key drivers like growth rates, EBITDA %, and CAPEX assumptions.
- Quarterly and Annual Statements: A complete breakdown of Inozyme Pharma, Inc.’s financials.
- Interactive Dashboard: Visualize valuation results and projections dynamically.
Disclaimer
All information, articles, and product details provided on this website are for general informational and educational purposes only. We do not claim any ownership over, nor do we intend to infringe upon, any trademarks, copyrights, logos, brand names, or other intellectual property mentioned or depicted on this site. Such intellectual property remains the property of its respective owners, and any references here are made solely for identification or informational purposes, without implying any affiliation, endorsement, or partnership.
We make no representations or warranties, express or implied, regarding the accuracy, completeness, or suitability of any content or products presented. Nothing on this website should be construed as legal, tax, investment, financial, medical, or other professional advice. In addition, no part of this site—including articles or product references—constitutes a solicitation, recommendation, endorsement, advertisement, or offer to buy or sell any securities, franchises, or other financial instruments, particularly in jurisdictions where such activity would be unlawful.
All content is of a general nature and may not address the specific circumstances of any individual or entity. It is not a substitute for professional advice or services. Any actions you take based on the information provided here are strictly at your own risk. You accept full responsibility for any decisions or outcomes arising from your use of this website and agree to release us from any liability in connection with your use of, or reliance upon, the content or products found herein.